Chart Sell analysis
- Confidence
- 85
- Entry
- 4,324.89
- Target
- 4,280.00
- Stop
- 4,340.00
- Published
- 2026-08-10
Summary
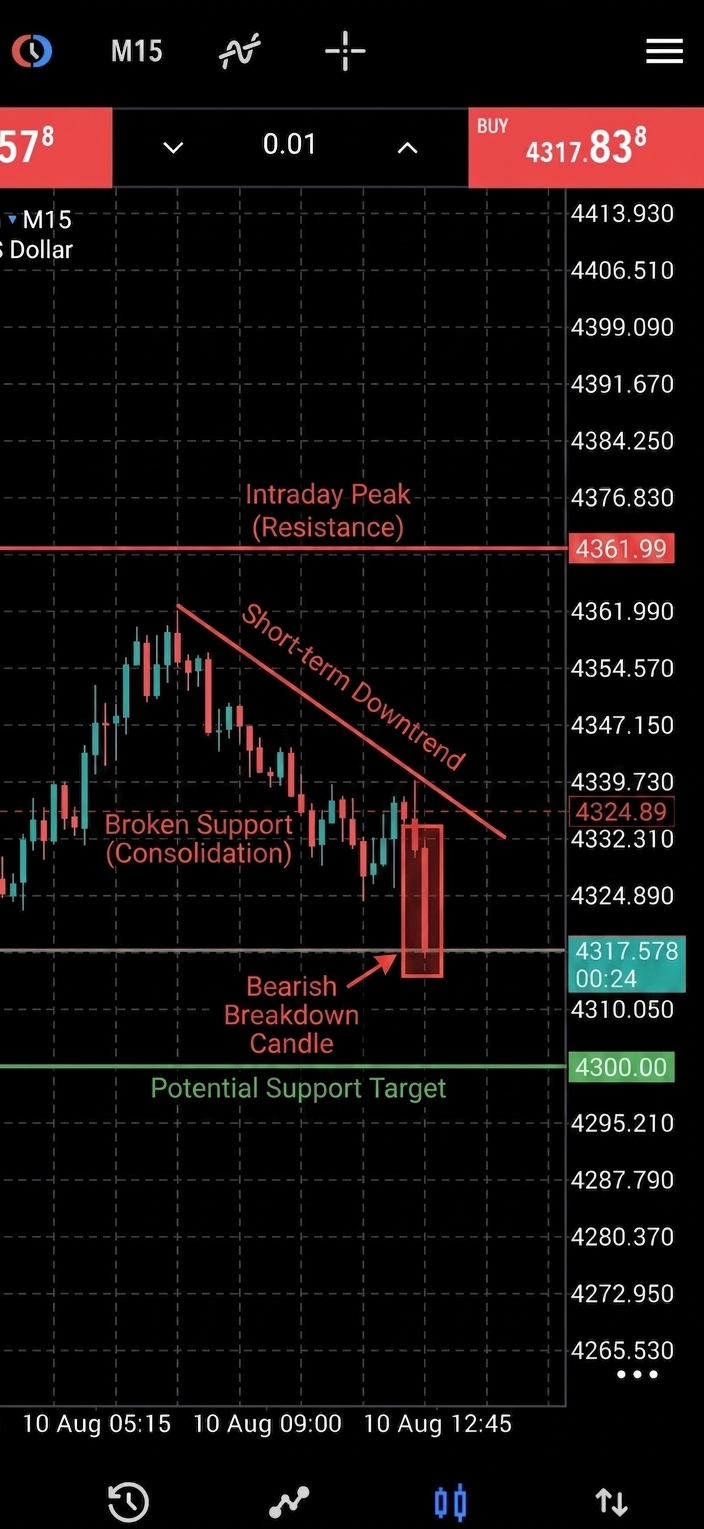
The asset has experienced a clear bearish reversal on the 15-minute timeframe after peaking near 4361.99, breaking below key minor support levels with a strong red momentum candle.
Trend
The short-term trend on this 15-minute chart has transitioned decisively from an initial advance to a clear downtrend. After reaching an intraday peak around 4361.99, the price established a pattern of lower highs and lower lows. The most recent candle shows a sharp acceleration in selling pressure, crashing through prior consolidation support around 4324.89 down to the current level of 4317.58. This aggressive impulse downward indicates strong bearish dominance and invalidates any immediate bullish continuation scenarios above 4340.
Patterns
A clear double-top/head-and-shoulders style distribution structure formed near the top around the 4361.99 zone. Following this distribution, the price consolidated briefly between 4324.89 and 4339.73 before printing a long marubozu-style bearish breakdown candle. This sharp breakdown confirms the completion of the distribution pattern and opens up further downside towards the next psychological handle around 4300.00 or lower.
Indicators
No technical overlay indicators like RSI, MACD, or Moving Averages are explicitly plotted on this chart setup. However, the price action itself shows strong negative momentum as evidenced by the expanding body size of the latest red candle dropping over 15 points in a single timeframe interval. The strong rejection from 4339.73 indicates overhead supply is overwhelmingly controlling the order book.
Strategy
The primary strategy is to sell into minor retracements or trade the continuation of this sharp breakdown. Triggers for short entries lie around the broken support zone near 4324.89 to catch a potential lower-high retest. The invalidation stop loss should be placed safely above the recent swing high at 4340.00, targeting lower support zones down around 4280.00 for a favorable risk-to-reward ratio.
For reference only, not investment advice. Trading decisions are your own.