BTC Buy analysis
- Confidence
- 75
- Entry
- 63,136
- Target
- 63,740
- Stop
- 62,550
- Published
- 2026-08-14
Summary
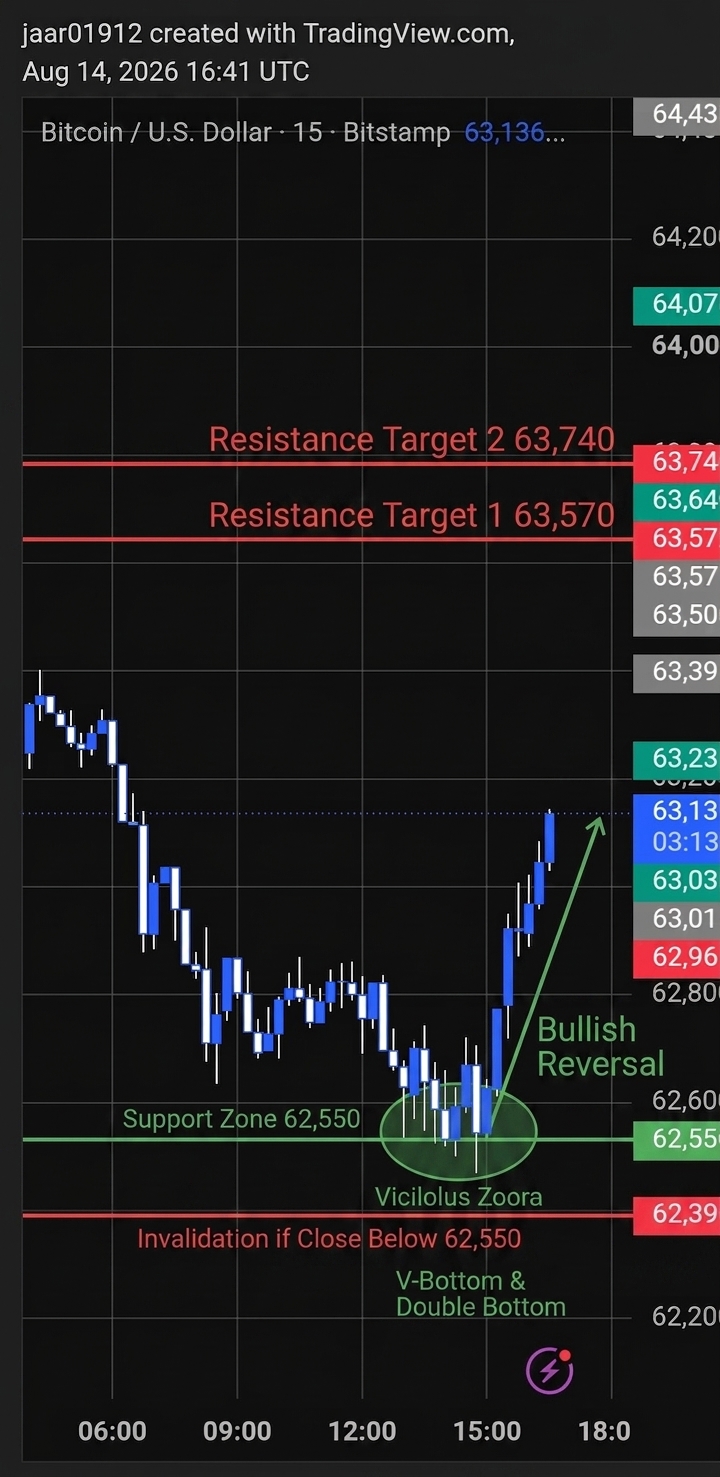
Bitcoin shows a strong intra-day V-shaped reversal from the 62,550 support zone, demonstrating aggressive buying pressure on the 15-minute timeframe. A continuation toward resistance at 63,570 and 63,740 is favored as long as price holds above recent local swing lows.
Trend
On this 15-minute chart, Bitcoin initially experienced a steady downtrend from the 63,400 peak down to a low near 62,550, representing approximately a 1.3% decline over roughly 9 hours. However, starting around 15:00 UTC, price printed consecutive strong bullish momentum candles that rapidly erased most of the preceding decline. The sharpness of this rebound shifts the short-term market structure back toward a bullish bias. Moving averages are not explicitly plotted, but price action currently trades well above the recent intraday range midpoint. A close back below 62,550 would invalidate this short-term bullish recovery.
Patterns
The price action reveals a clear V-bottom reversal pattern formed around the 62,550 support floor between 14:30 and 15:15 UTC. Large blue bullish expansion candles broke out forcefully, confirming aggressive absorption of supply at lower levels. Additionally, a minor double bottom structure is visible around the 62,550–62,600 area prior to the explosive upside move. The projected target for this V-shaped breakout points toward the prior supply area around 63,570 to 63,740.
Indicators
Traditional technical indicators such as RSI, MACD, and volume sub-panels are not rendered on this minimal chart layout. However, purely price-action based momentum analysis reveals very high buying velocity evidenced by back-to-back full-body bullish candles moving from 62,600 straight to 63,136 without significant pullbacks. The horizontal price labels on the right axis outline key reaction zones, with immediate overhead resistance positioned near 63,230 and 63,390.
Strategy
A long entry is recommended near current market levels around 63,136 to ride the short-term bullish momentum. Stop-loss protection should be placed tightly below the recent swing low cluster at 62,550 to limit downside risk. The primary take-profit objective is set near 63,740, offering a solid risk-to-reward ratio. Traders should monitor price reaction near 63,390 for potential resistance pause before target reaching.
For reference only, not investment advice. Trading decisions are your own.