TREEUSDT Buy analysis
- Confidence
- 75
- Entry
- 0.0380
- Target
- 0.0450
- Stop
- 0.0348
- Published
- 2026-08-19
Summary
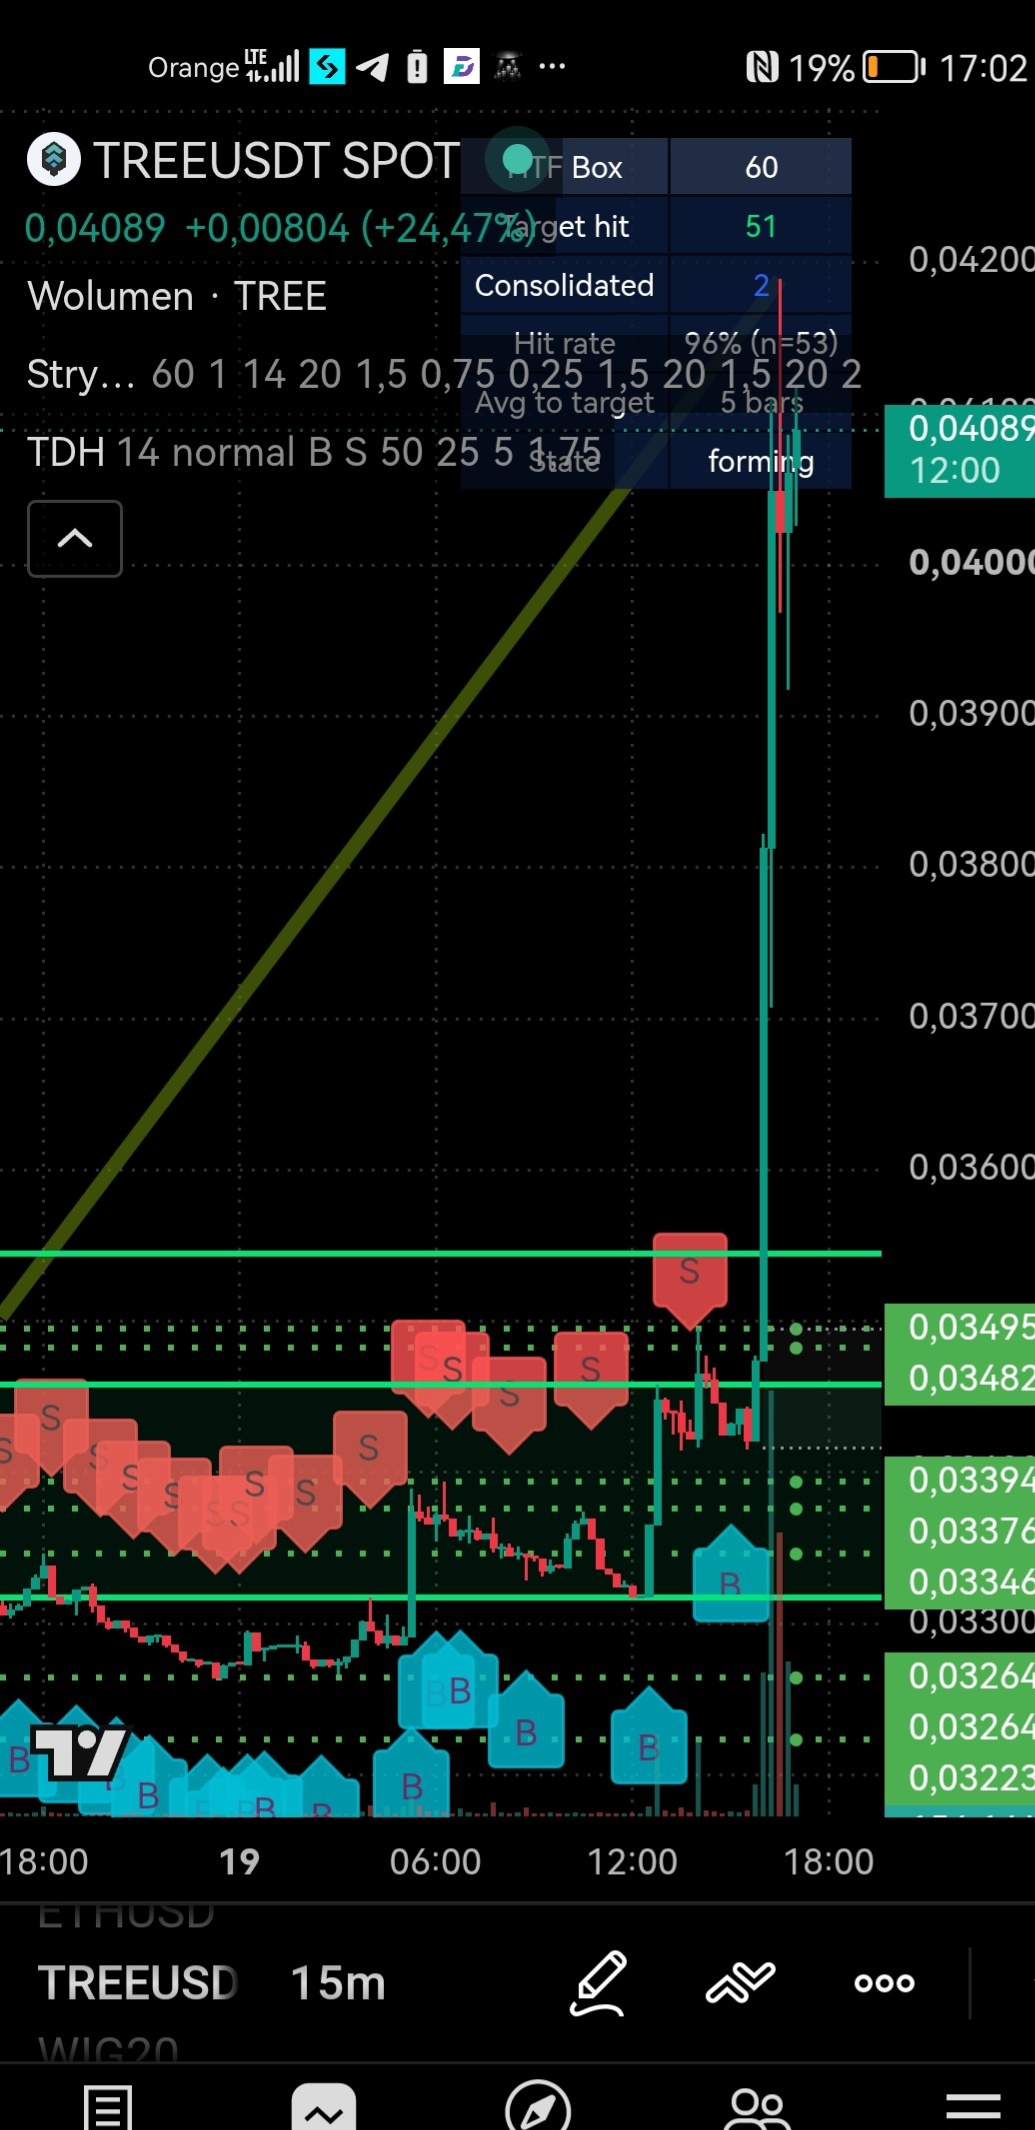
TREEUSDT has experienced an explosive bullish breakout, surging over +24% in a single impulsive move well above its multi-day consolidation zone. Strong upward momentum suggests potential for further continuation after a minor pullback or consolidation above broken resistance.
Trend
Prior to the recent expansion, TREEUSDT was trading within a tight horizontal accumulation range bounded by 0.03300 support and 0.03550 resistance. The recent 15-minute candle broke dramatically out of this range, taking price directly to a high near 0.04100. Moving averages are steeply sloping upward beneath the current price action, confirming a parabolic shift into a strong bullish short-term trend. The trend remains strongly bullish as long as price holds above the prior breakout ceiling around 0.03550.
Patterns
The price action demonstrates a classic breakout from a long-standing rectangular consolidation base. A massive bullish expansion candle ('god candle') cleared multiple resistance levels at 0.03482, 0.03495, and 0.03550 in one swift wave. The formation shows a strong displacement of supply with minimal upper wick rejection so far, signaling aggressive buyer dominance. A retest of the top of the previous structure near 0.03600-0.03800 would offer a favorable continuation entry pattern.
Indicators
Volume during this breakout candle has spiked significantly compared to the multi-session average, validating the authenticity of the move. Momentum indicators reflect extreme buying strength, pushing values into overbought territory which is typical during initial impulse waves. The automated strategy overlay shows a recent 'B' (Buy) signal preceding this major upward expansion, aligning with the current bullish momentum. No major negative divergence is visible yet on shorter timeframes.
Strategy
Wait for a minor pullback toward the 0.03800 region to secure a favorable risk-reward entry rather than chasing the exact top. Set a tight stop-loss below the major breakout support level at 0.03480 to limit downside risk. Target psychological resistance levels higher up around 0.04500 for take-profit execution. Given the volatility of such vertical moves, maintain strict position sizing.
For reference only, not investment advice. Trading decisions are your own.