BOMEUSDT Buy analysis
- Confidence
- 75
- Entry
- 0.0008517
- Target
- 0.0009200
- Stop
- 0.0007981
- Published
- 2026-08-19
Summary
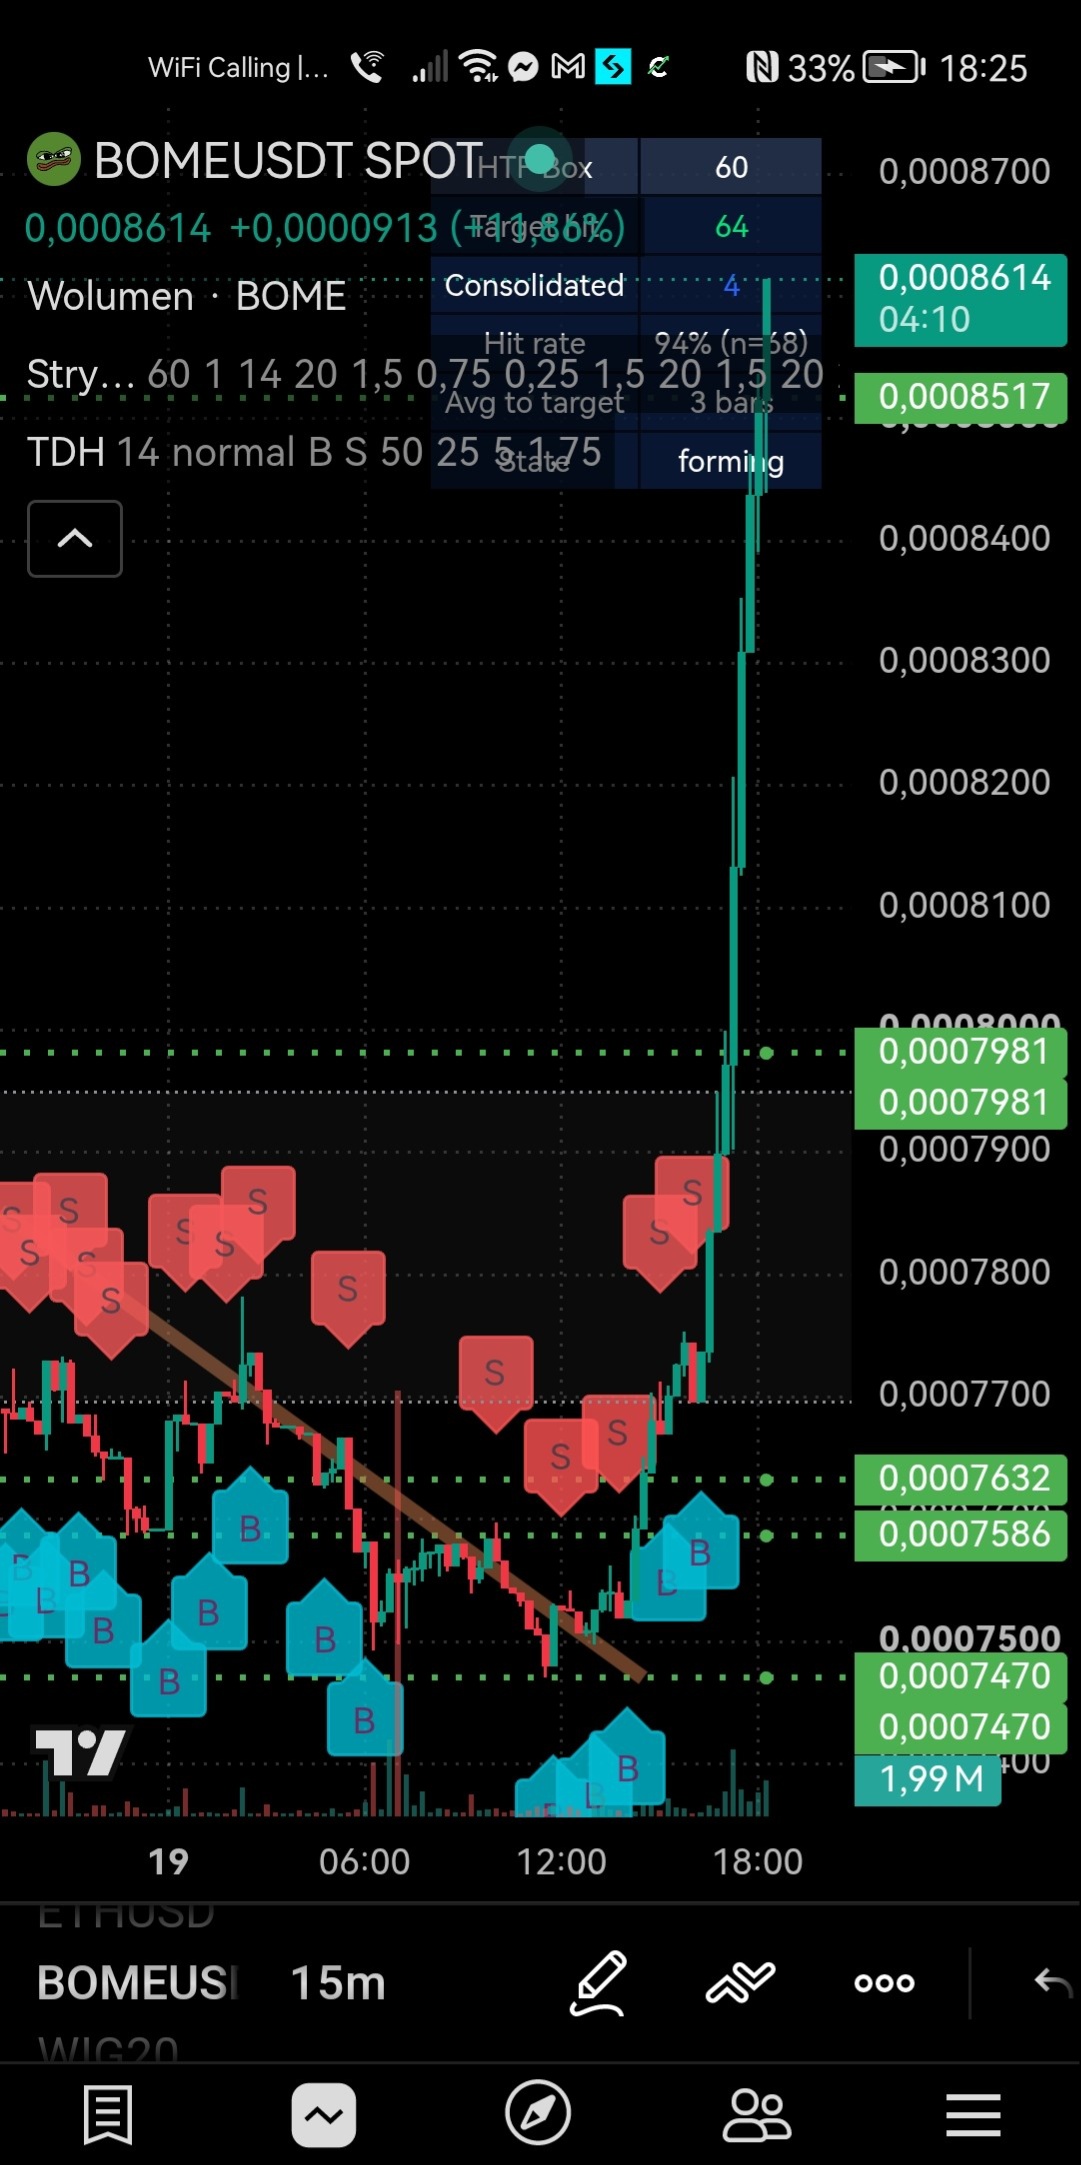
BOMEUSDT has executed an explosive parabolic breakout following the collapse of a downward trendline around the 0.0007500 level. The sudden influx of strong buying volume has driven price action rapidly through key horizontal resistances, signaling strong bullish continuation momentum.
Trend
The 15-minute chart shows a transition from a localized downtrend into an aggressive vertical markup phase. Prior price action was constrained beneath a descending trendline that capped rallies between 0.0007800 and 0.0007500 throughout the session. The decisive vertical candle broke above this trendline and cleared successive resistance levels at 0.0007632 and 0.0007981, pushing price to a current high around 0.0008614 (+11.86%). The short-term trend is now strongly bullish, and a hold above 0.0007981 keeps this explosive momentum intact.
Patterns
A clear downward trendline breakout pattern unfolded as price consolidated tightly near 0.0007470 before expanding upward. Following the breakout, a large vertical green expansion candle formed, characteristic of a momentum breakout or short-squeeze pattern. The formation suggests buyers are heavily in control, with the prior resistance at 0.0007981 now acting as the primary retest support zone. A sustained hold above this region opens up a measured move toward the 0.0009200 to 0.0009500 target zone.
Indicators
Multiple 'B' (Buy) buy-signal labels appeared around the bottom near 0.0007470 to 0.0007586 prior to the rally, signaling accumulation by technical algorithms. Trading volume expanded sharply during the current 15-minute candle to roughly 1.99M units, validating the authenticity of the price surge. Momentum indicators shown on the overlay indicate an active forming state with high hit-rate metrics (94%) aiming for higher target boxes near 0.0008700.
Strategy
The recommended strategy is to capitalize on the powerful breakout momentum while managing entry risk against a potential temporary pullback. Traders can look to position long around 0.0008500 or on a slight dip toward the 0.0008200-0.0008500 area. A protective stop loss should be placed below the breakout structure at 0.0007981 to limit risk in case of a rapid mean-reversion. Profit targets are set near 0.0009200 and higher toward 0.0009500, offering a solid risk-to-reward setup.
For reference only, not investment advice. Trading decisions are your own.