RTNPOWER Sell analysis
- Confidence
- 75
- Entry
- 7.85
- Target
- 7.20
- Stop
- 8.15
- Published
- 2026-08-26
Summary
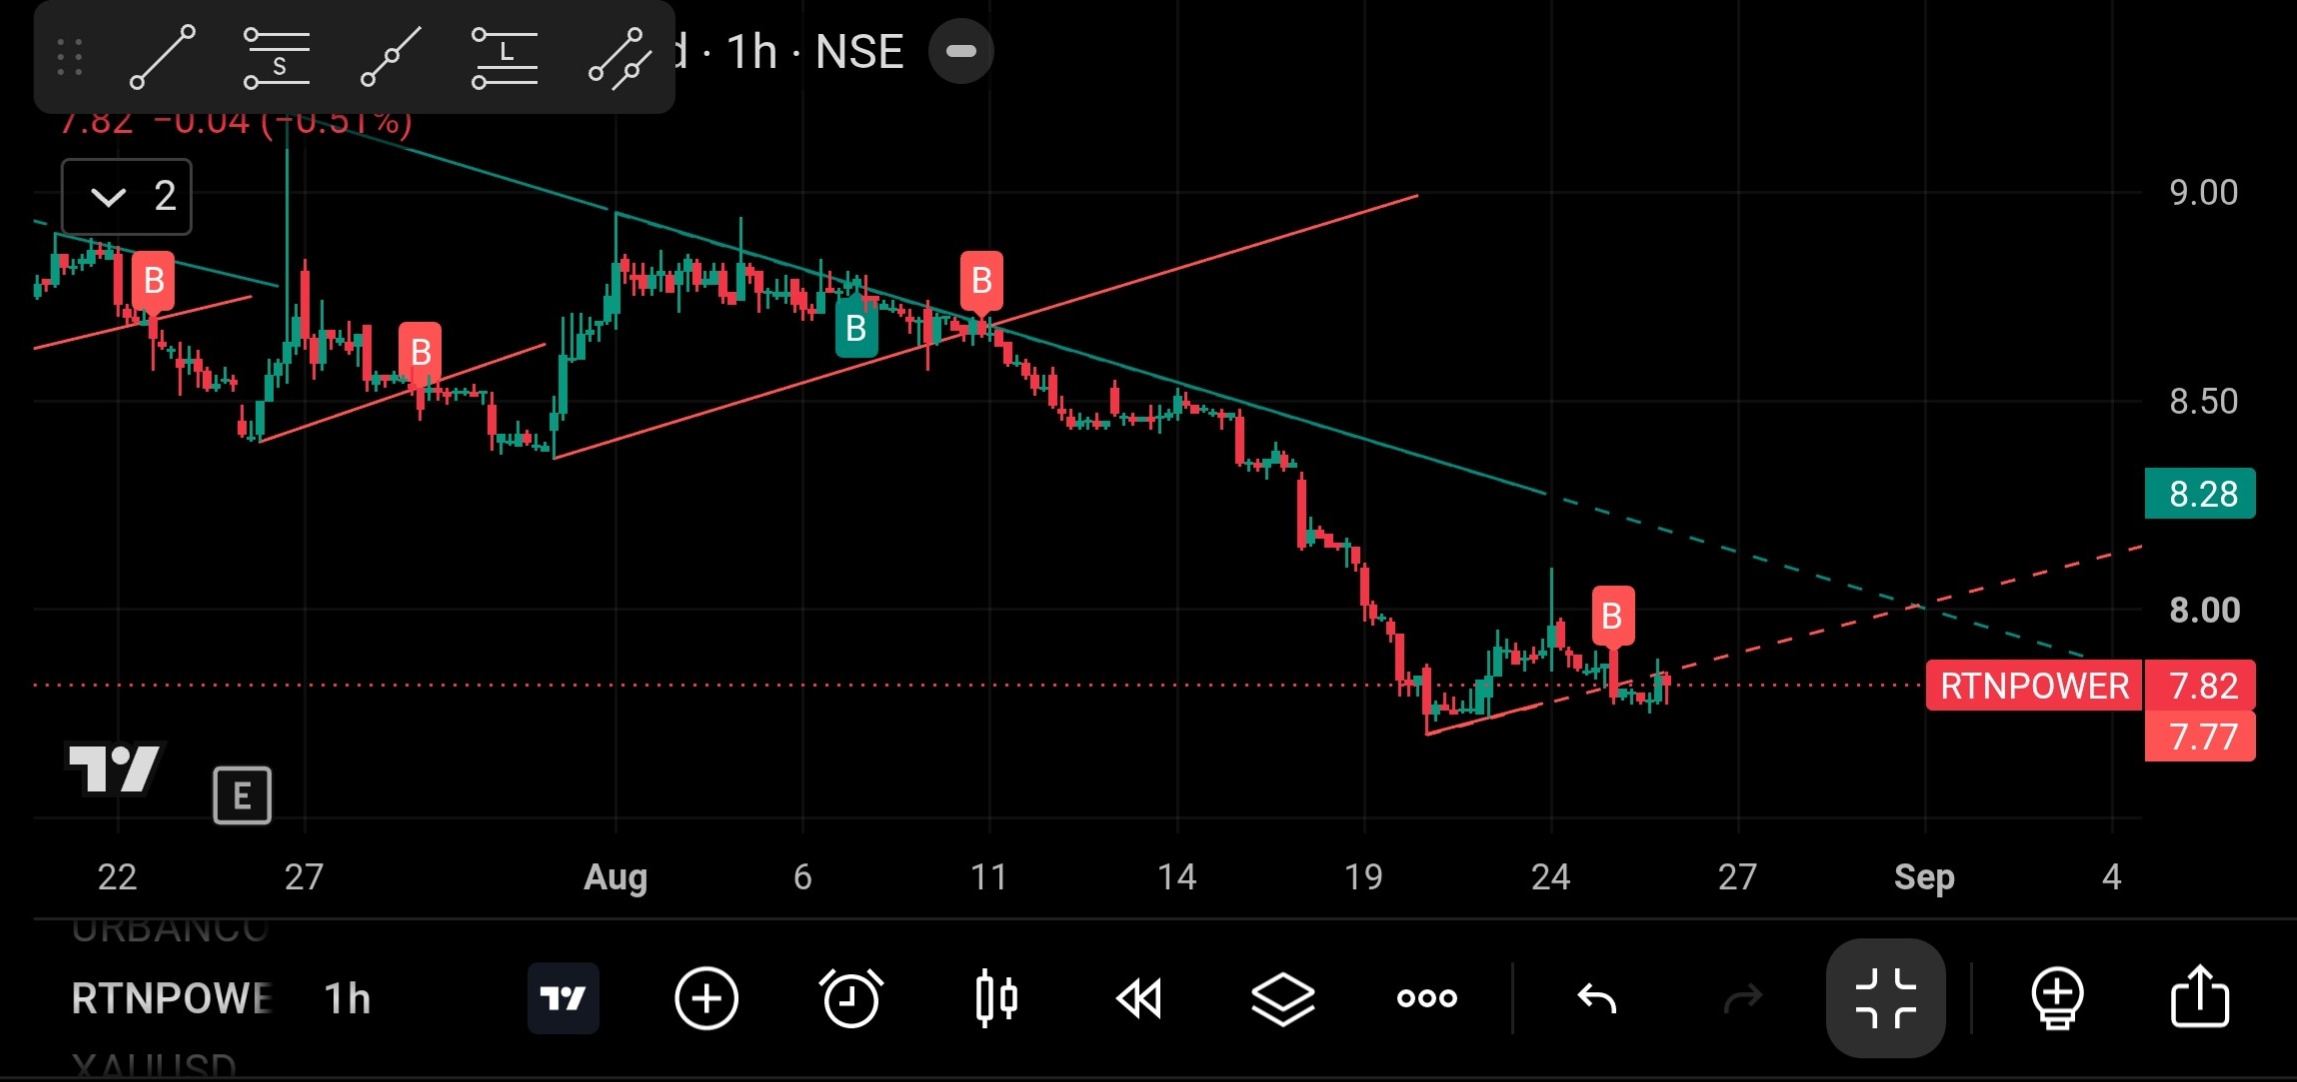
RTNPOWER is in a clear, persistent hourly downtrend, making lower highs and lower lows below key resistance trendlines. The current minor bounce is failing at localized support-turned-resistance near 7.82, opening up risk for further downside.
Trend
The asset has been making a sustained bearish correction since reaching peak levels near 9.00 in late July/early August. The price action reflects persistent lower highs and lower lows on the 1-hour timeframe, falling sharply around August 19 to a trough near 7.60. The price currently trades around 7.82, remaining positioned strictly below the main falling trendline originating from the August highs. Moving averages are not explicitly plotted, but the steep downward trajectory confirms strong short-to-medium term bearish momentum.
Patterns
The chart exhibits a prominent descending wedge/triangle pattern defined by the upper descending green trendline and lower support structures. After breaking down from an earlier symmetrical pattern around mid-August near 8.60, the price dropped aggressively toward 7.60. A small bear pennant or consolidation flag has formed between 7.60 and 8.00 over recent sessions, which typically acts as a continuation pattern signaling a potential leg lower toward 7.20.
Indicators
Standard technical indicators like RSI and MACD are not explicitly overlaid on this layout. However, the price structure itself shows weakness with weak, short-lived green candles followed by immediate selling pressure near 8.00. Volume indicator panels are omitted, but price action indicates heavy distribution during breakdown moves and lack of strong demand on bounces.
Strategy
The primary setup favors short positions or avoiding long entries while the trendline resistance remains intact. Traders can look to initiate short positions on minor pullbacks near 7.85-7.90 or on a breakdown below recent swing support at 7.70. A tight stop loss should be placed above 8.15 to invalidate the bearish setup, with an initial price target near 7.20.
For reference only, not investment advice. Trading decisions are your own.