SKRUSDT Sell analysis
- Confidence
- 75
- Entry
- 0.022056
- Target
- 0.019800
- Stop
- 0.023700
- Published
- 2026-09-02
Summary
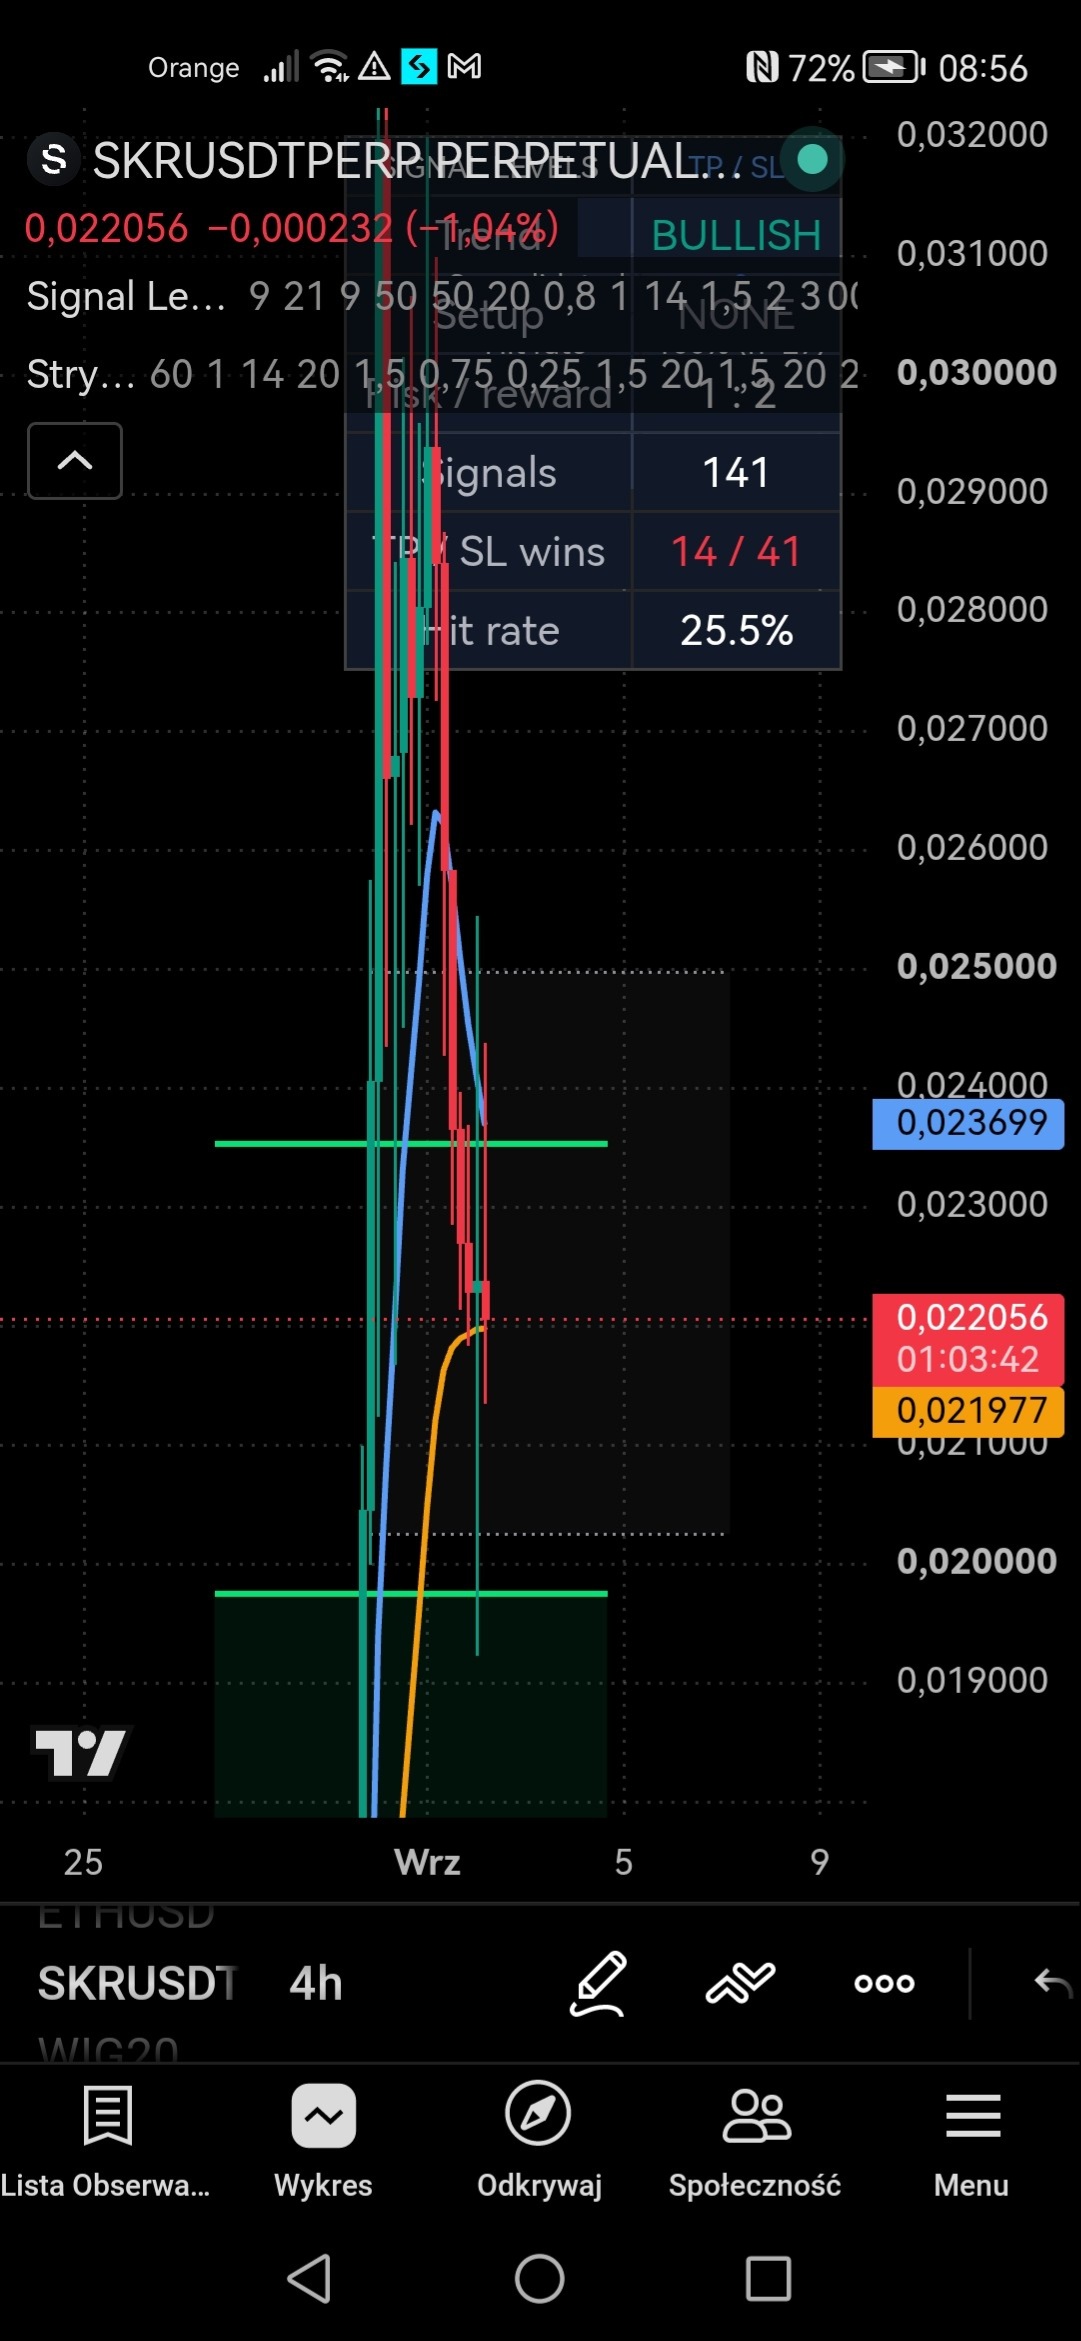
SKRUSDT recently experienced a sharp parabolic spike up towards the 0.031000 level followed by an immediate and aggressive sell-off, signaling a pump-and-dump distribution. Price action is breaking back below prior breakout levels, indicating heavy downside momentum towards lower support zones.
Trend
The short-term trend on the 4-hour chart shows an extreme expansion followed by an equally violent contraction. After reaching a peak above 0.031000, price printed consecutive long red candles, wiping out over 60% of the initial move. Price has sliced below the blue moving average line (~0.023699) and is currently pressing against the orange line at 0.021977. A breakdown below 0.021977 will invalidate any remaining bullish structure and open the door for a complete retracement back to the base around 0.019800.
Patterns
The chart exhibits a classic parabolic spike and sharp reversal (inverted V-shape pattern). The failure to consolidate near the highs indicates intense selling pressure and lack of buying interest at elevated levels. A lower high structure is being established as price rapidly loses key horizontal levels. The next major demand zone resides around the lower green highlighted support box near 0.019800.
Indicators
The price has crossed below the fast blue moving average level near 0.023699, which now acts as immediate dynamic resistance. The lower orange moving average support around 0.021977 is currently being tested under heavy selling pressure. Traditional oscillators like RSI or MACD are not explicitly displayed on this layout, but the steep negative slope of the price bars confirms strong bearish momentum.
Strategy
Look for a continuation short trade or liquidation of long positions as price breaks under 0.022000. A stop loss should be placed above the immediate resistance level at 0.023700 to manage risk effectively. Target lower support zones around 0.019800 where buyers previously established a base structure.
For reference only, not investment advice. Trading decisions are your own.