MAGMAUSDT Sell analysis
- Confidence
- 75
- Entry
- 0.55167
- Target
- 0.45706
- Stop
- 0.59500
- Published
- 2026-09-02
Summary
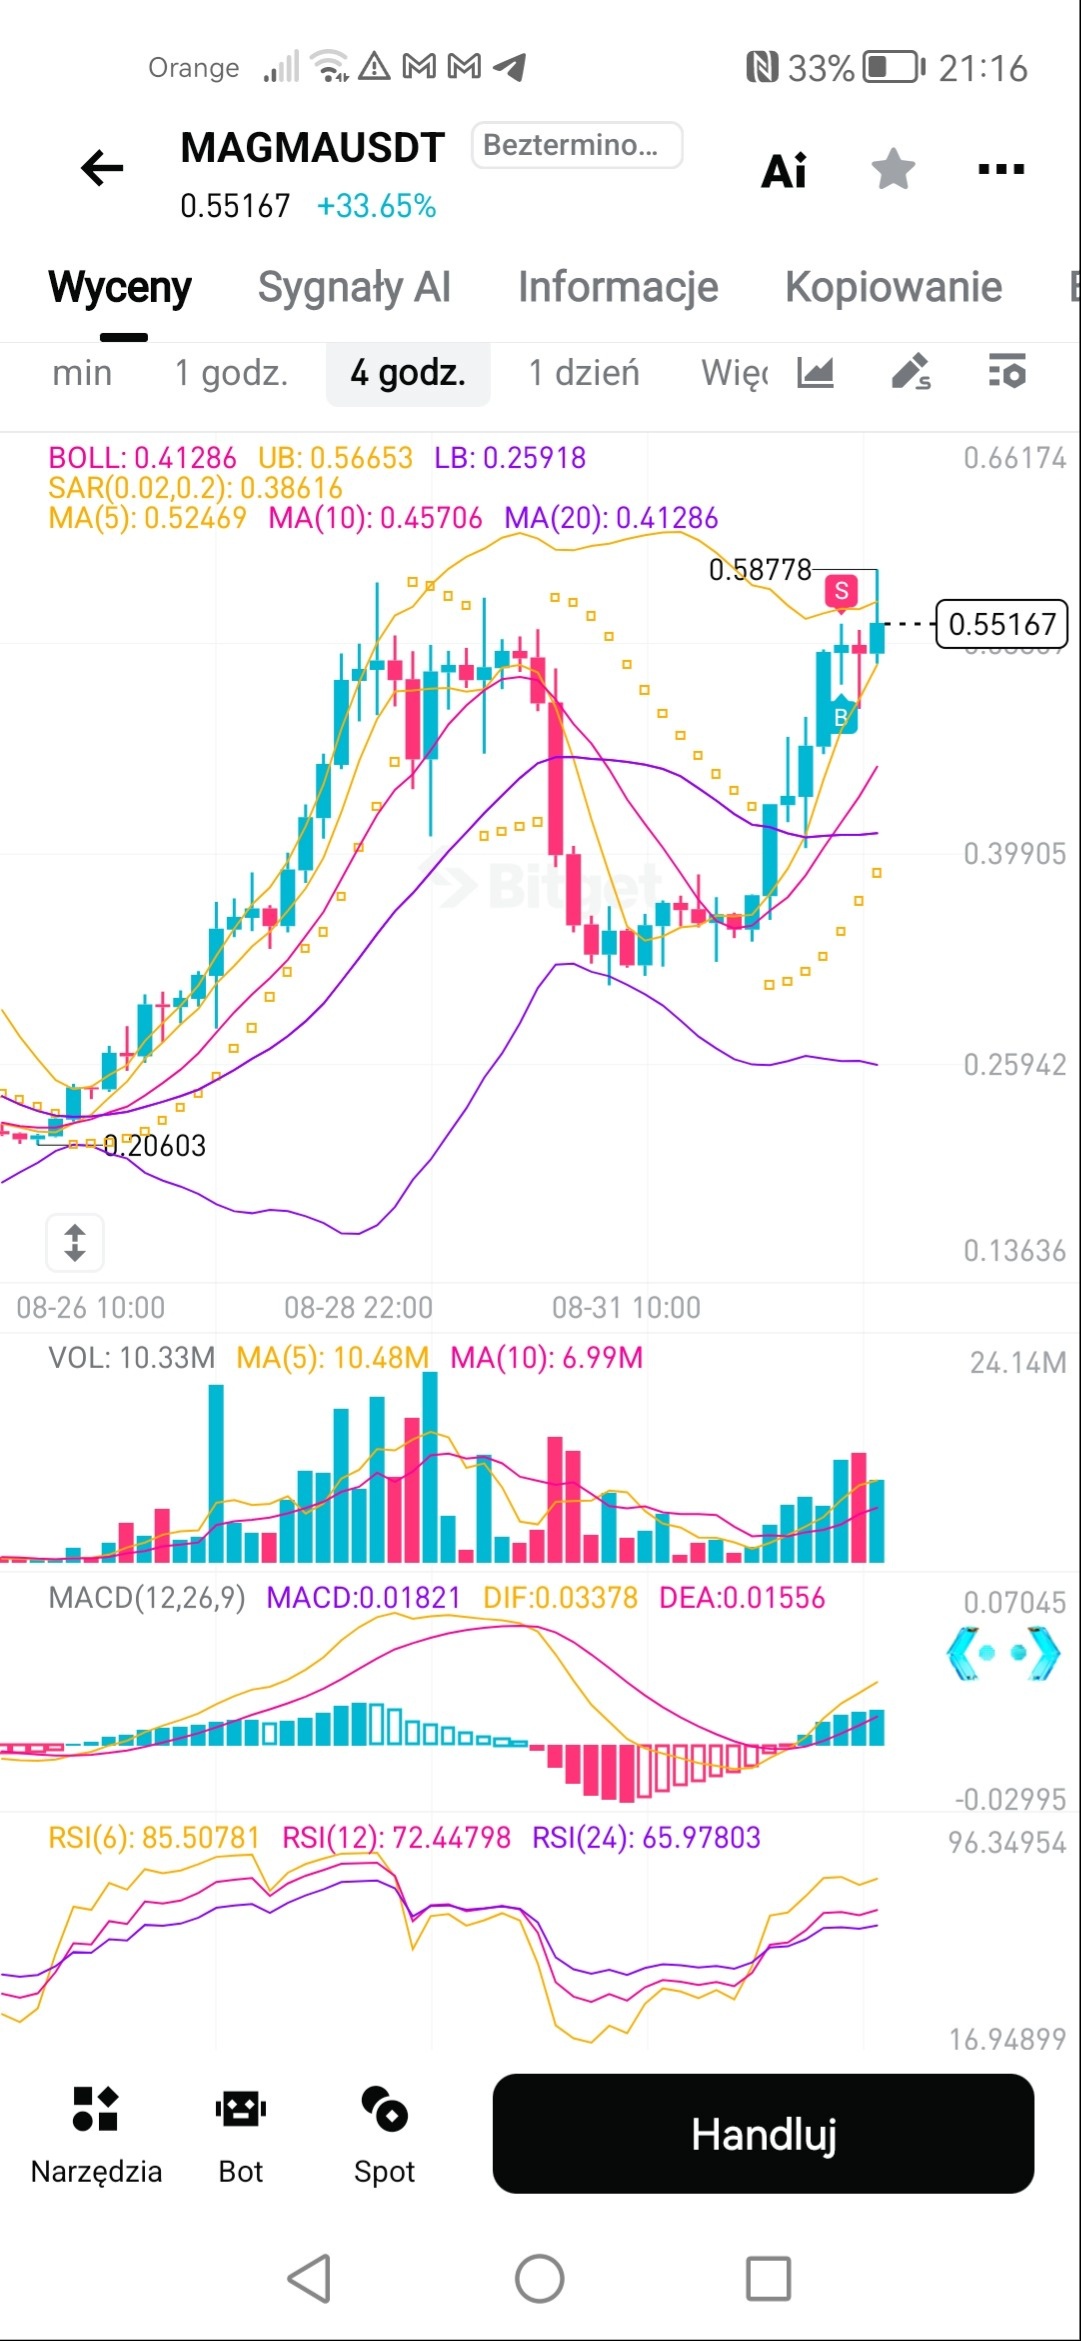
MAGMAUSDT has experienced a massive +33.65% surge to 0.55167, but it is displaying clear signs of exhaustion near resistance at 0.58778. With the 6-period RSI severely overbought at 85.50 and a prominent upper wick on the latest 4-hour candle, a short-term correction toward key moving average supports is highly probable.
Trend
The asset recently completed a strong vertical impulse move from the 0.35 consolidation base up to a high of 0.58778 on the 4-hour timeframe. While the short-term moving averages are in a bullish alignment—MA(5) at 0.52469, MA(10) at 0.45706, and MA(20) at 0.41286—the current price is overextended far above the 20-period baseline. A break back below the MA(5) at 0.52469 would invalidate the immediate parabolic phase and confirm a deeper correction toward the 0.45706 support zone.
Patterns
The 4-hour candle chart shows a sharp rejection pattern near 0.58778 marked by a long upper shadow, indicating aggressive profit-taking by buyers. Additionally, an automated sell/signal icon 'S' has printed near the local peak of 0.58778. This combined structure forms a potential short-term topping pattern or blow-off top characteristic of localized parabolic climaxes.
Indicators
The RSI indicators are severely stretched, with RSI(6) currently at 85.51, RSI(12) at 72.45, and RSI(24) at 65.98, pointing to an unsustainable overbought state. While the MACD line (DIF: 0.03378) remains above the signal line (DEA: 0.01556) with a positive histogram of 0.01821, momentum is beginning to plateaus. Price is hugging the upper Bollinger Band (UB: 0.56653), which typically caps immediate upside potential without extensive consolidation.
Strategy
Traders holding long positions should look to lock in profits or reduce exposure given the overbought condition and upper shadow at 0.58778. Aggressive short-term traders can capitalize on a mean-reversion move with an entry around 0.55167, targeting a pullback toward the 10-period MA near 0.45700. Invalidation for this tactical sell bias occurs if price breaks convincingly above the recent swing high of 0.58778.
For reference only, not investment advice. Trading decisions are your own.