BTCUSDT Sell analysis
- Confidence
- 75
- Entry
- 77,194
- Target
- 76,000
- Stop
- 77,550
- Published
- 2026-09-12
Summary
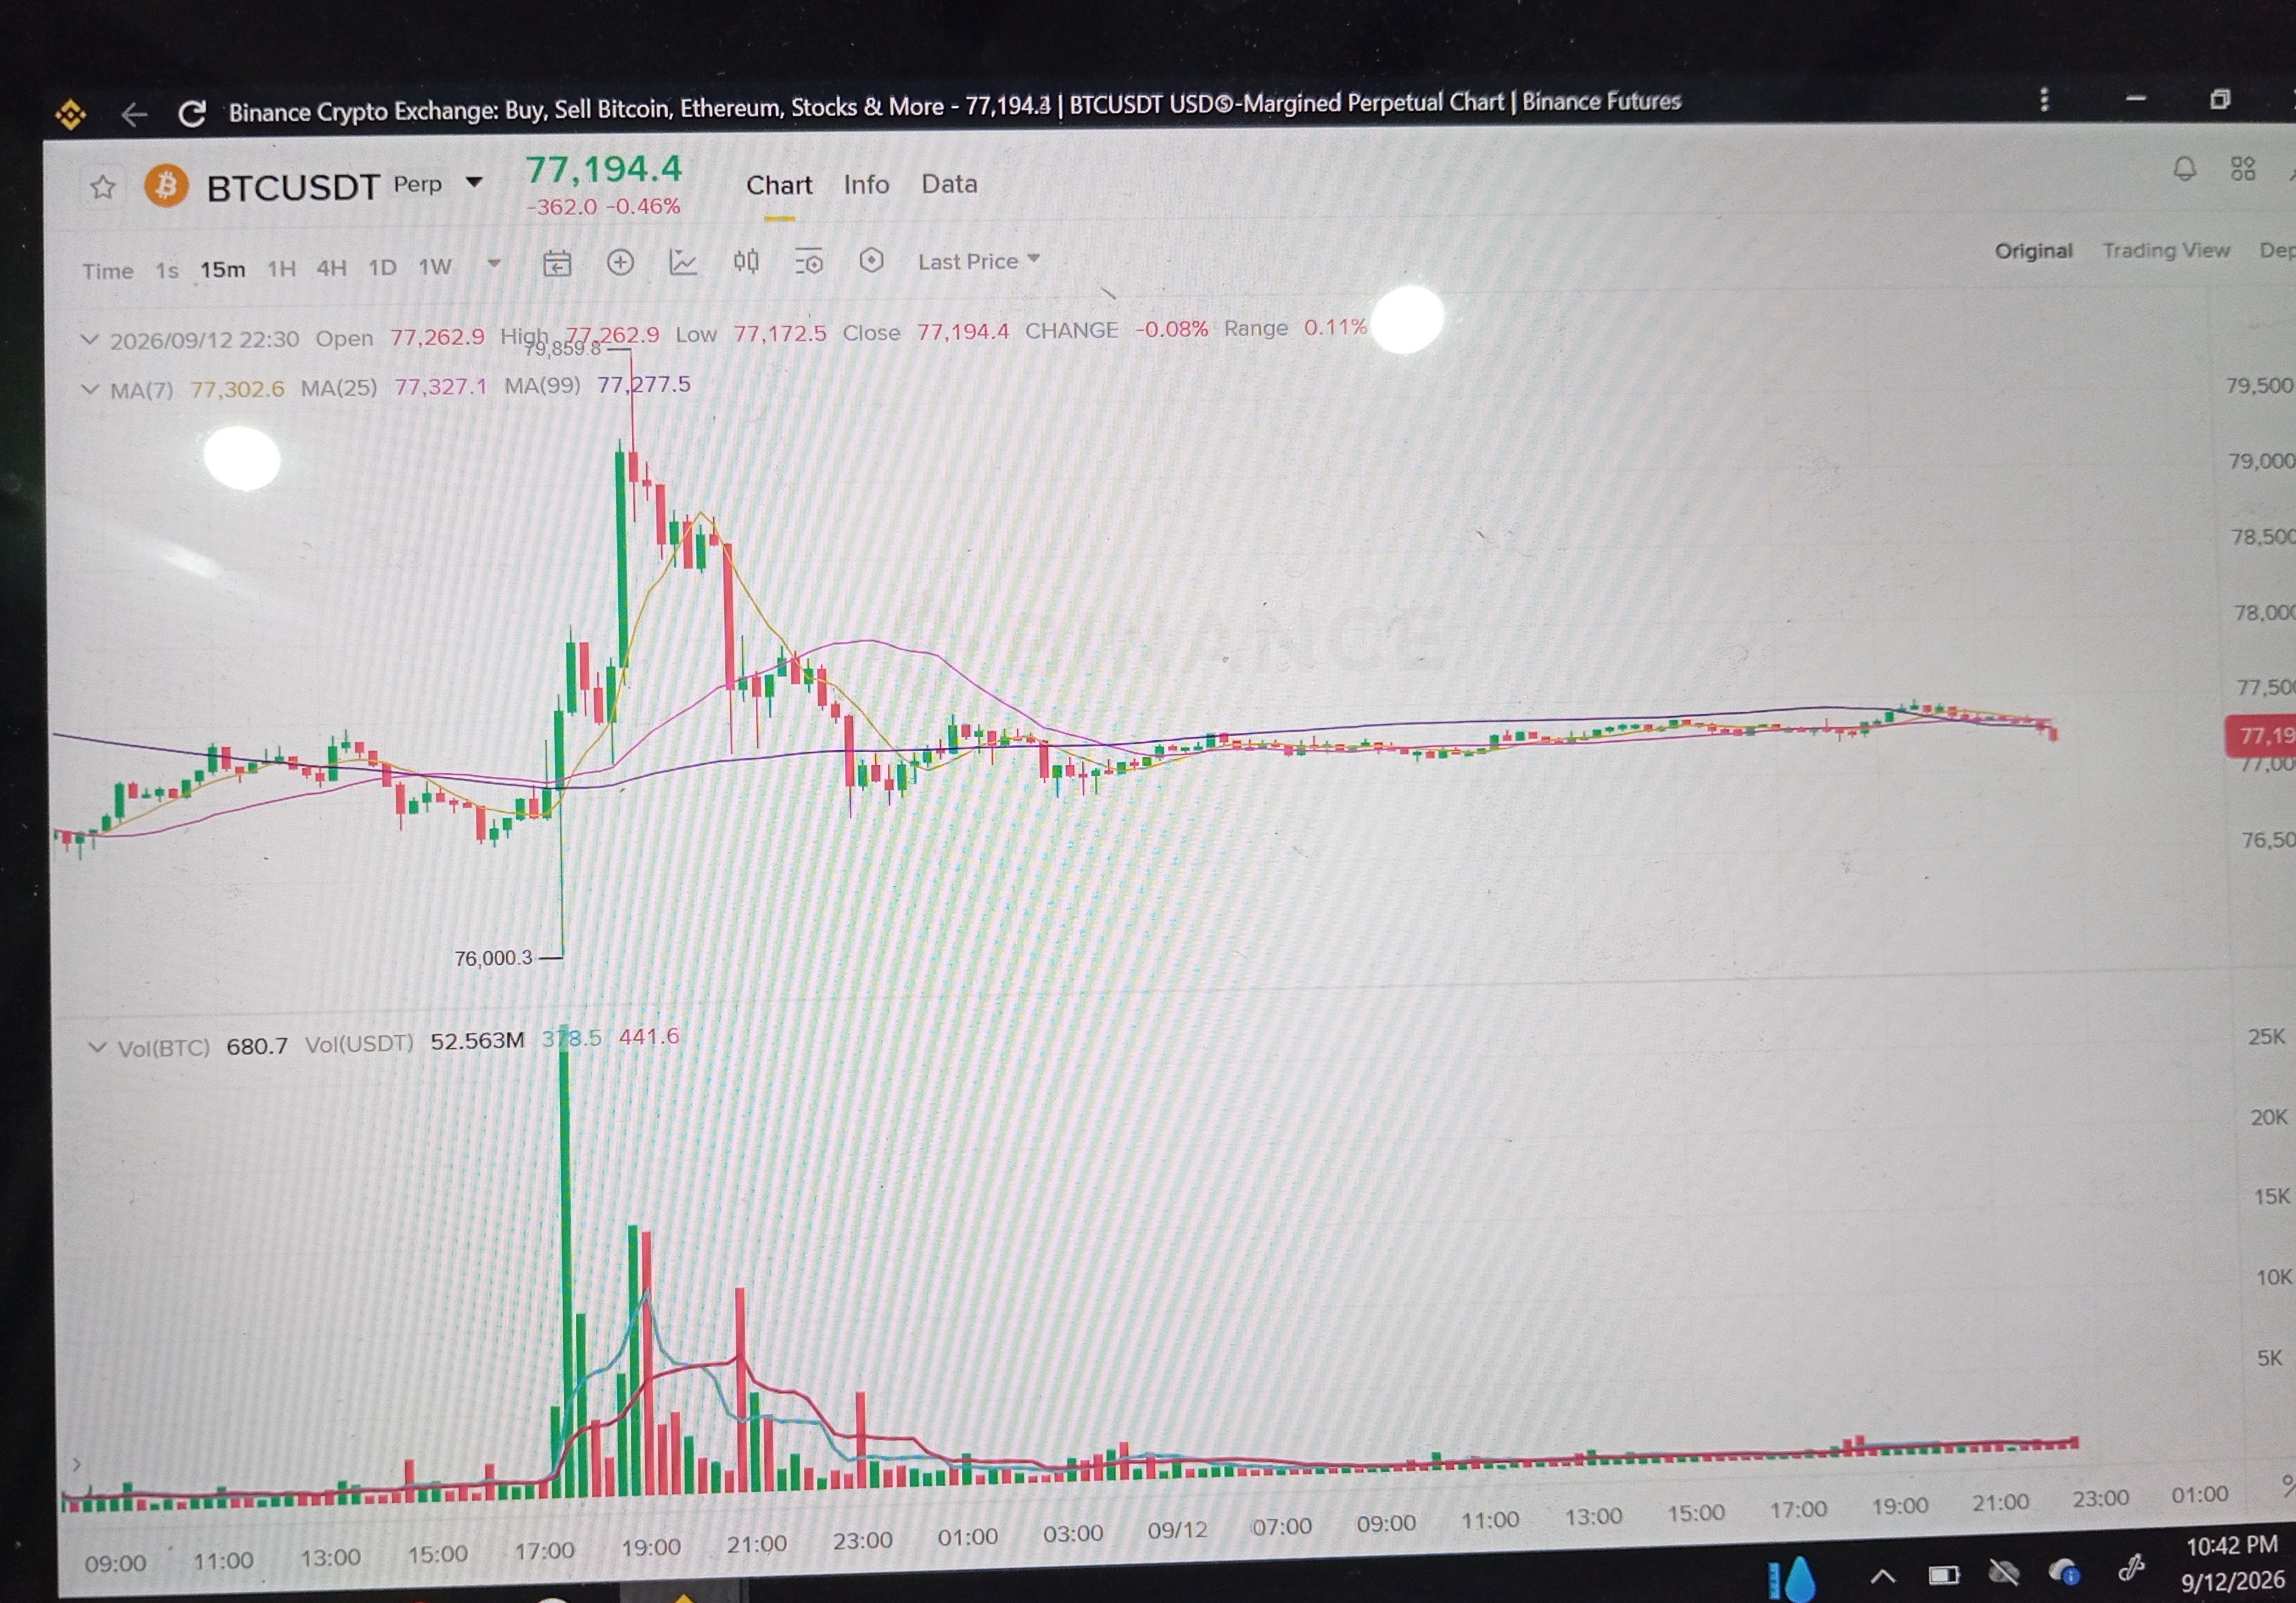
BTCUSDT experienced a dramatic volatility spike up to 79,859.8 followed by a swift dump, and has now entered a low-volume sideways drift below key moving averages. The failure to sustain higher levels and the current trading position below MA(7), MA(25), and MA(99) indicate persistent bearish pressure.
Trend
The short-term 15-minute chart shows a clear break of the parabolic upward move, shifting into a short-term downtrend and subsequent tight consolidation. Price action is currently situated at 77,194.4, below the 7-period MA (77,302.6), 25-period MA (77,327.1), and 99-period MA (77,277.5). The converging, downward-sloping moving averages directly above the current price create a strong resistance overhead. A break below the recent swing low around 76,000.3 would confirm a deeper structural decline.
Patterns
The chart exhibits a classic sharp 'pump and dump' spike pattern that reached a local peak of 79,859.8 before collapsing back toward baseline levels. Following the sharp drop, price has formed a tight horizontal bear-consolidation channel between 77,100 and 77,400. This flat, low-volatility pattern following a steep decline typically acts as a bearish continuation flag, favoring a downside breakdown toward major support.
Indicators
Volume profile shows a huge surge during the rapid price rally and sell-off (peaking above 25k volume units), but trading volume has completely evaporated during the current drift, sitting near recent lows. Moving averages (MA7 at 77,302.6, MA25 at 77,327.1, MA99 at 77,277.5) are tightly clustered above current price action, acting as dynamic dynamic dynamic resistance. Oscillators like RSI or MACD are not explicitly plotted, but the compressed price action below all key MAs indicates fading momentum and elevated risk of a downside break.
Strategy
A short position is favored targeting a retest of the lower support boundary. Entry can be taken at the market level of 77,194 or on a light bounce toward the MA cluster near 77,300. Set a strict stop-loss above the moving average resistance cluster at 77,550 to limit risk against false breakdowns. The primary profit target is set near the major horizontal support level at 76,000.
For reference only, not investment advice. Trading decisions are your own.