XAU/USD Sell analysis
- Confidence
- 75
- Entry
- 4,382
- Target
- 4,356
- Stop
- 4,398
- Published
- 2026-09-18
Summary
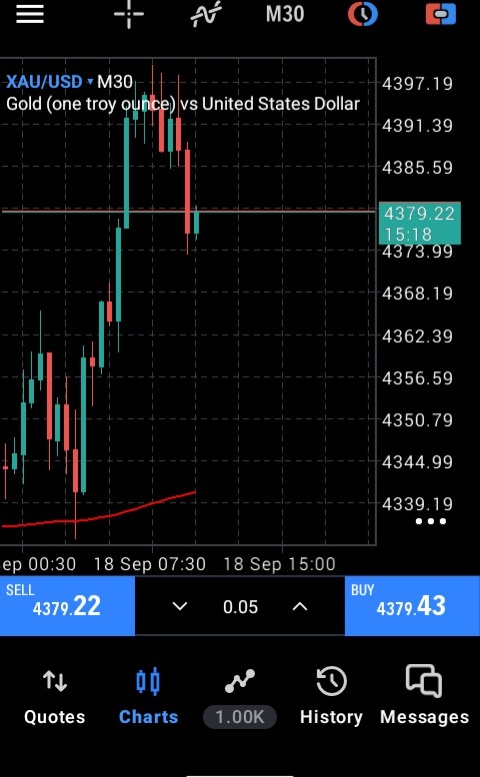
Gold (XAU/USD) reached a local peak near 4397.19 on the 30-minute timeframe before experiencing a sharp rejection with a strong bearish engulfing move down to 4373.99. The immediate momentum has shifted downward, suggesting a corrective wave back toward lower support levels.
Trend
The prior micro-trend was strongly bullish, surging rapidly from the 4340.00 base up to test near 4397.19. However, the inability to sustain gains above 4395.00 led to a sudden surge in selling pressure that retraced more than half of the recent rally in just a few candles. A red moving average line is visible well below the current price near 4340.00, confirming that while the higher-timeframe trend remains upward, the immediate 30-minute trend is undergoing a sharp pull-back. This short-term bearish reversal remains valid as long as prices stay under the recent local high of 4397.19.
Patterns
The price action formed a double-top structure near 4397.19 followed immediately by a decisive bearish engulfing candle on the 30-minute chart. This setup indicates severe overhead supply and profit-taking at key psychological resistance. The long upper wicks on the top candles further reinforce strong seller dominance at upper levels. The immediate downside target for this reversal pattern lies around the 4362.39 to 4356.59 consolidation area.
Indicators
A single red moving average line is plotted at the bottom around 4340.00, trending gently upward, showing long-term baseline support far below current levels. Oscillators like RSI, MACD, and volume panels are not displayed on this specific chart interface and are thus unavailable for direct numerical reading. However, the sheer size of the recent red candlestick indicates a significant spike in selling volume and negative momentum.
Strategy
Look to take a short position on slight upward retracements toward the 4382.00 level to capitalize on the ongoing corrective push downward. Set a tight stop loss just above the swing high at 4398.00 to manage risk effectively. The initial profit target is set at 4356.00, where previous consolidation provides logical structural support. Maintain strict position sizing given potential volatility in intraday gold moves.
For reference only, not investment advice. Trading decisions are your own.