XAUUSD Buy analysis
- Confidence
- 70
- Entry
- 4,378
- Target
- 4,800
- Stop
- 4,200
- Published
- 2026-09-20
Summary
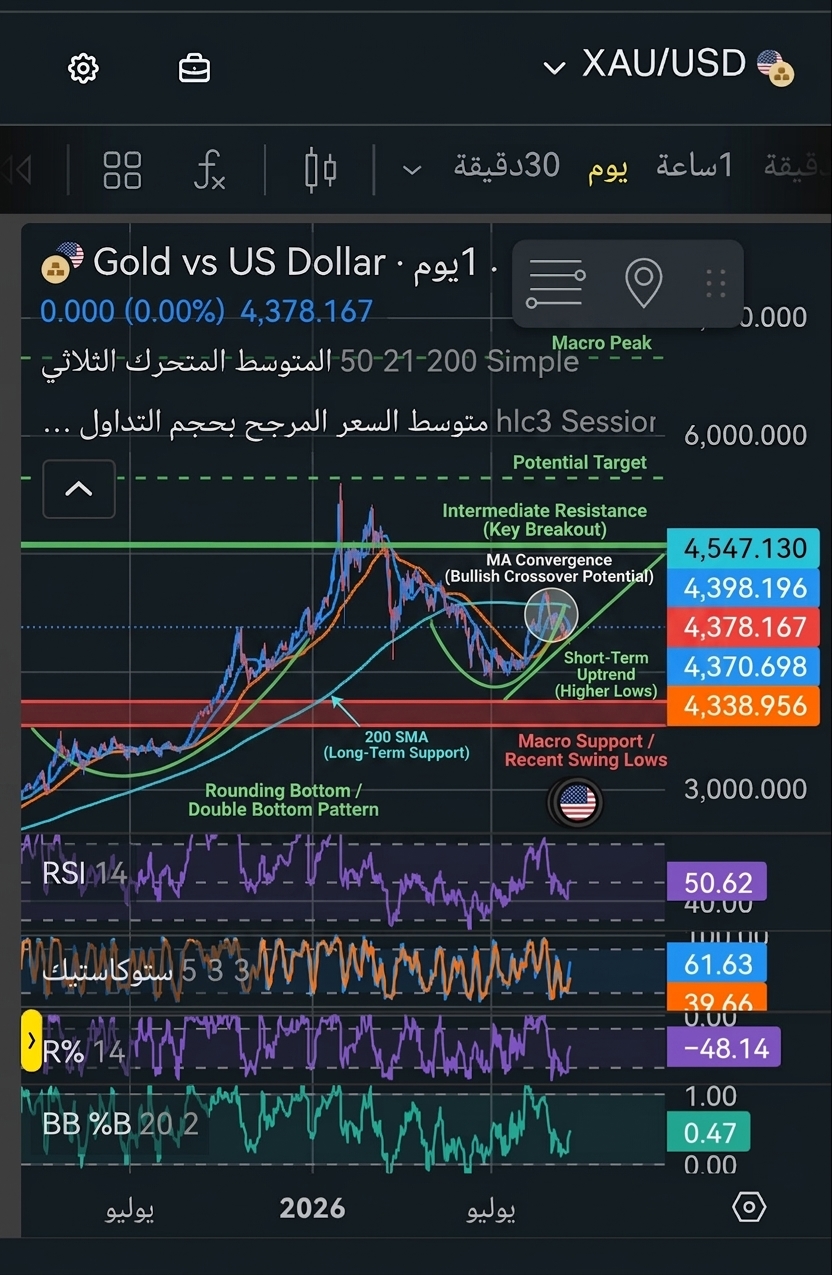
Gold (XAU/USD) on the daily timeframe has corrected from its massive peak and found solid support near the long-term moving average, showing signs of a bullish reversal. With indicators holding around neutral-to-bullish zones and price rebounding toward key resistance, momentum favors a long trade toward recent swing highs.
Trend
The macro uptrend remains intact as price holds firmly above the long-term 200-day simple moving average (currently around 4370 level). After a significant corrective phase following the sharp peak near 5500+, the asset established a strong higher low and bounced decisively. The shorter-term 21-day and 50-day moving averages (orange and blue lines around 4338 to 4398) are converging, indicating a potential bullish crossover. As long as price stays above the recent swing low around 4100-4200, the broader bullish market structure remains valid.
Patterns
The price action displays a classic double-bottom/rounding bottom recovery pattern following a deep corrective pullback from macro high levels. A clear swing low was established in the lower 4,000s region, followed by a series of higher highs and higher lows on the daily scale. Price is currently testing a crucial intermediate resistance node around 4547; a break above this level confirms a continuation toward 5000+ levels.
Indicators
Relative Strength Index (RSI 14) is sitting comfortably at 50.62, representing a neutral-to-bullish balance point with ample room to run upward. The Stochastic Oscillator (14, 3, 3) shows %K at 61.63 crossing above %D at 39.66, signaling renewed short-term bullish momentum. Williams %R (14) stands at -48.14, indicating price is recovering from oversold conditions. Additionally, Bollinger Bands %B sits at 0.47, right near the midline, suggesting potential for an expansion toward the upper band.
Strategy
Consider establishing a long position around the current price zone near 4378 to 4398. Place a stop-loss order below the immediate support cluster and moving averages near 4200 to protect capital. The first major take-profit target should be set near the local resistance level of 4800, with a secondary extended target toward 5200 if bullish momentum accelerates.
For reference only, not investment advice. Trading decisions are your own.