XAUUSDm Sell analysis
- Confidence
- 75
- Entry
- 4,345
- Target
- 4,310
- Stop
- 4,365
- Published
- 2026-09-22
Summary
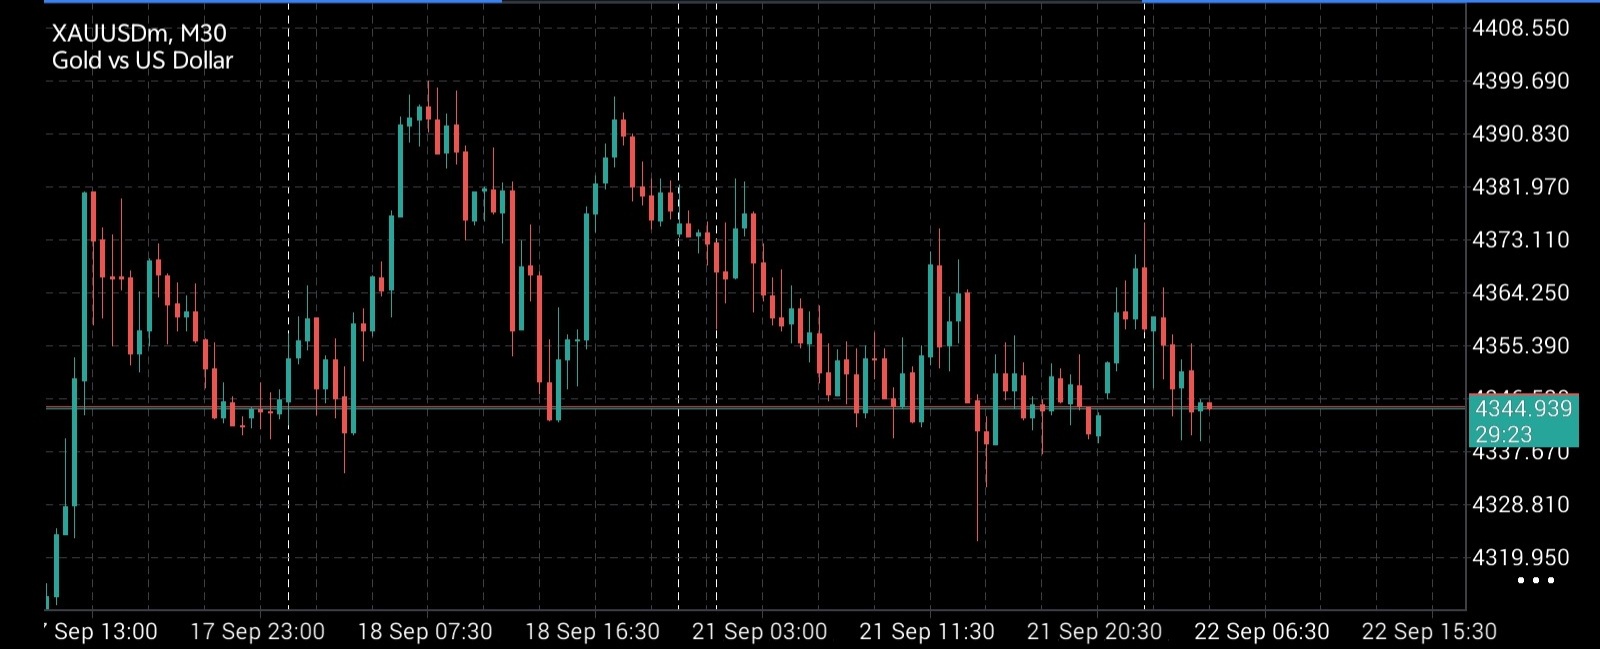
Gold (XAUUSDm) on the 30-minute chart exhibits a clear short-term bearish structure characterized by a sequence of lower highs and lower lows. A recent breakdown below key horizontal support around 4355 suggests further downside potential toward the recent wick lows near 4320.
Trend
The 30-minute chart demonstrates a clear downward trajectory after peaking near the 4400 resistance level on September 18. Since reaching that high, the price has consistently formed lower peaks at approximately 4390, 4373, and most recently near 4368. Price is currently trading below the intermediate consolidation range near 4345, confirming ongoing bearish momentum. A persistent close back above the 4373 pivot level would be required to invalidate this dominant intraday downtrend.
Patterns
The price action displays a classical descending triangle / lower-high distribution pattern spanning from September 18 to September 22. Noticeable bearish rejection wicks formed around 4373 during the September 21 session, followed by sharp red candles driving price back toward support. The recent breach of the 4350-4355 horizontal shelf confirms that sellers remain in firm control, targeting a retest of the spike low around 4320.
Indicators
Standard momentum indicators such as RSI and MACD are not explicitly overlaid on this minimalist chart template. However, price action itself demonstrates strong negative momentum with substantial long red candles dominating recent M30 intervals. Volume and oscillator sub-panes are currently unavailable on this view, so directional bias relies primarily on pure market structure and candlestick geometry.
Strategy
Look for short entries on minor retests toward the broken support turned resistance at 4345. Set a stop loss above the recent swing high at 4365 to limit upside risk in case of a false breakdown. Target the previous liquidity sweep low near 4310 for an attractive risk-to-reward ratio of greater than 1:1.7.
For reference only, not investment advice. Trading decisions are your own.