BTCUSD Sell analysis
- Confidence
- 75
- Entry
- 85,415
- Target
- 84,830
- Stop
- 85,750
- Published
- 2026-09-22
Summary
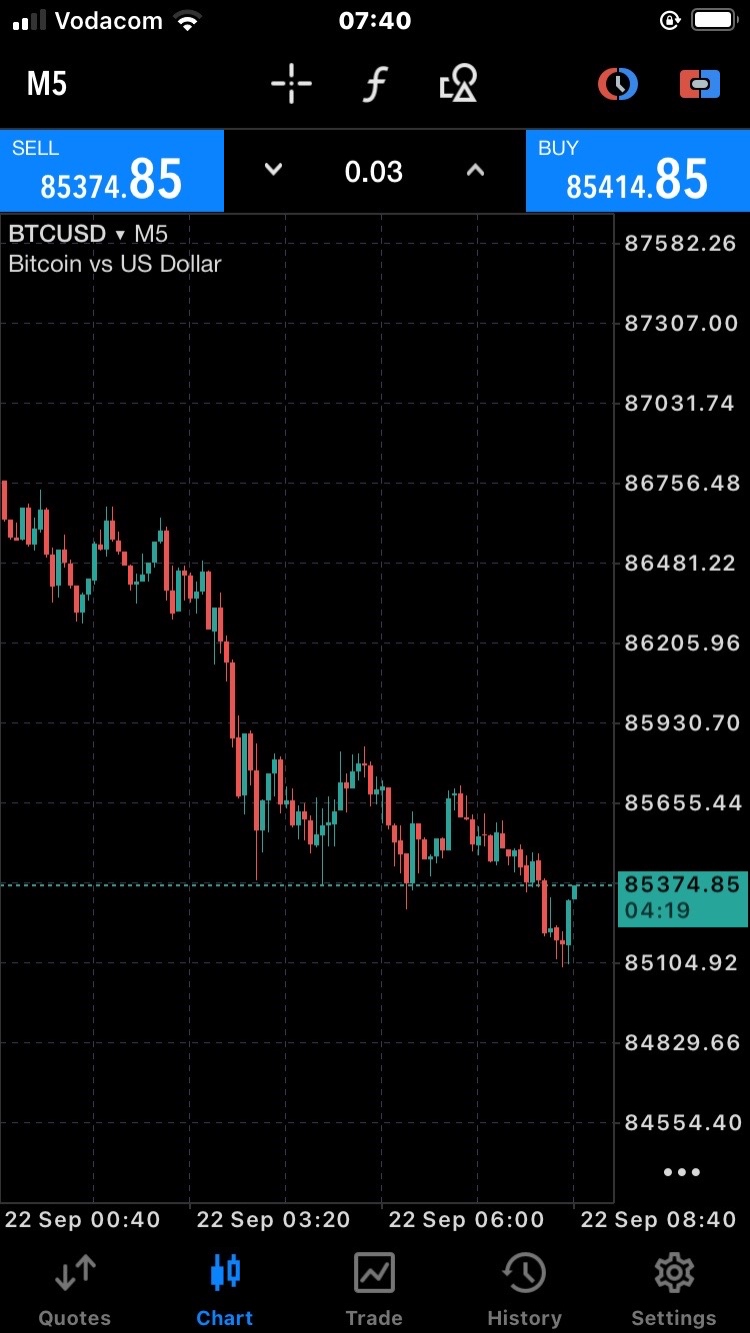
The 5-minute BTCUSD chart displays a dominant short-term downtrend characterized by strong bearish momentum and consecutive lower lows. A brief pull-back is currently attempting to form, presenting a tactical shorting opportunity on a rejection near immediate resistance.
Trend
The 5-minute chart shows a strong short-term downtrend that originated near the 86756 level and extended down to a local low around 85104. The magnitude of this drop spans roughly 1650 points within a short period, illustrating clear selling dominance. Moving averages are not explicitly plotted, but the steep downward trajectory of price action indicates that short-term moving averages would be sharply sloping downward above current price levels. A recovery above the previous lower high near 85655 would be required to invalidate the current bearish momentum.
Patterns
The price action demonstrates a classical downtrend structure composed of sharp bearish expansion legs followed by weak, corrective consolidation periods. A significant impulse move lower broke through intermediate support around 85655 to reach 85104 before producing a minor bullish pin bar / hammer candle. This current green candle represents a short-term bounce within a broader bearish flag or channel structure. The pattern implies a potential continuation of the sell-off toward the 84829 level after the brief retracement exhausts.
Indicators
Traditional technical indicators such as RSI, MACD, and volume are not present on this specific display layout. However, pure price action analysis shows aggressive red candles dominating the lower time frame structure, confirming steady downward momentum. The current green candle showing a rejection from 85104 indicates minor demand at lower levels, but overall selling pressure remains dominant. Additional secondary indicators are unavailable on this MetaTrader chart view.
Strategy
Look for short entry opportunities as the current minor bounce retests broken support turned resistance around 85450 to 85550. Maintain a strict stop loss above the local swing high at 85750 to manage risk effectively. Target the immediate support levels at 85100 and a continuation target down toward 84830. Ensure appropriate position sizing (such as the indicated 0.03 lot size) to keep total account risk within standard risk parameters.
For reference only, not investment advice. Trading decisions are your own.