GOLDi Sell analysis
- Confidence
- 75
- Entry
- 4,172.52
- Target
- 4,145.00
- Stop
- 4,195.00
- Published
- 2026-10-01
Summary
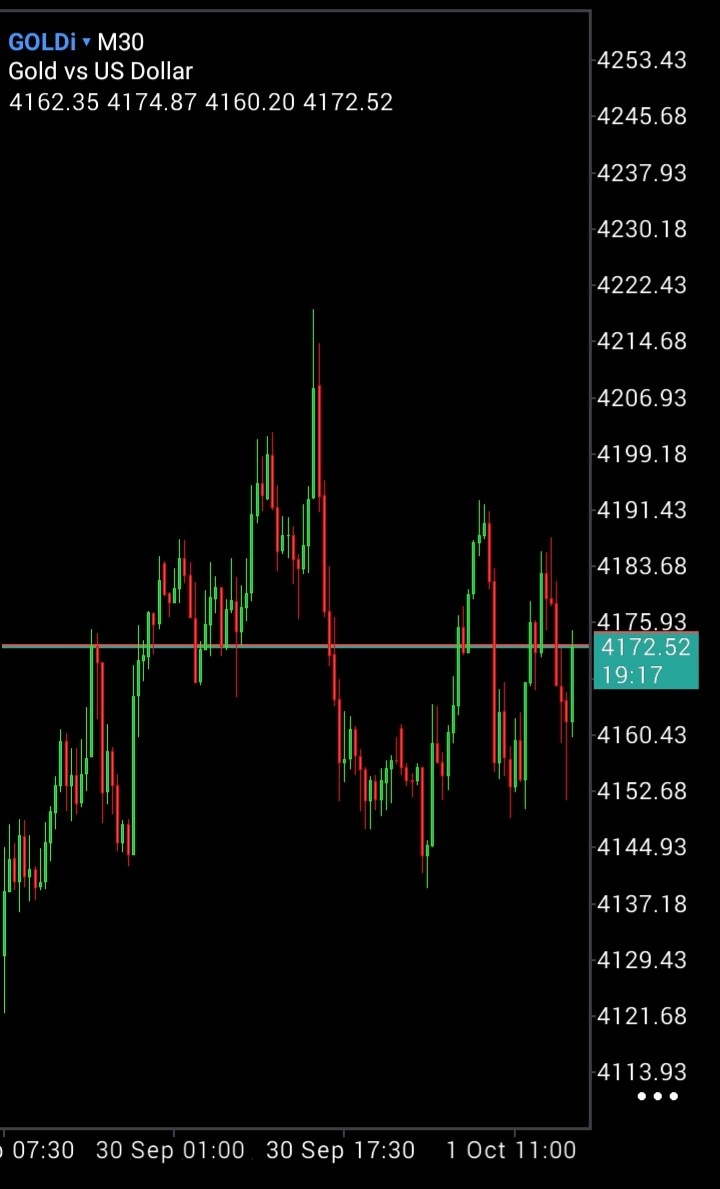
Gold (GOLDi) on the 30-minute timeframe has printed a clear lower high at 4193 following a steep drop from the 4222 peak, signaling a shift to bearish momentum. Selling near the current price of 4172.52 targets the recent support low near 4145.
Trend
The 30-minute chart shows a transition from an aggressive uptrend to a corrective/bearish structure after peaking at 4222. Price experienced a rapid move down to the 4145 zone, marking a strong liquidation event. The subsequent recovery attempt stalled sharply at 4193, establishing a definitive lower high on the M30 structure. Until price cleanly reclaims the 4193 level, the short-term trend favors downside pressure toward the lower bound of the newly formed range.
Patterns
A classical lower-high peak structure has formed following the sharp impulse move down from 4222 to 4145. The bounce to 4193 failed to build bullish continuation and formed a bearish rejection wick on the M30 chart. Recent candles near 4172.52 show hesitation with red real bodies, indicating seller dominance whenever prices attempt to push higher. This price action strongly suggests a retest of the major swing low around the 4145 support area.
Indicators
Moving averages and oscillator indicators are not explicitly displayed as overlays on this clean price action chart. However, pure price action shows distinct rejection wick behavior around 4185-4193 and a series of lower intraday highs. Volume indicators are also absent from this sub-panel view, making volume confirmation unavailable on this specific feed. The analysis relies primarily on horizontal structural key levels and candlestick market structure.
Strategy
Initiate a short position around the current market price of 4172.52, capitalizing on the rejection at 4193. Set a strict stop-loss order above the lower-high pivot at 4195 to manage risk effectively in case of an upside breakout. Place the primary take-profit target near the key horizontal support zone at 4145, providing a favorable risk-to-reward ratio. Position sizing should adhere to strict risk guidelines, risking no more than 1-2% of total trading account equity.
For reference only, not investment advice. Trading decisions are your own.