Chart Buy analysis
- Confidence
- 75
- Entry
- 100
- Target
- 115
- Stop
- 94
- Published
- 2026-10-17
Summary
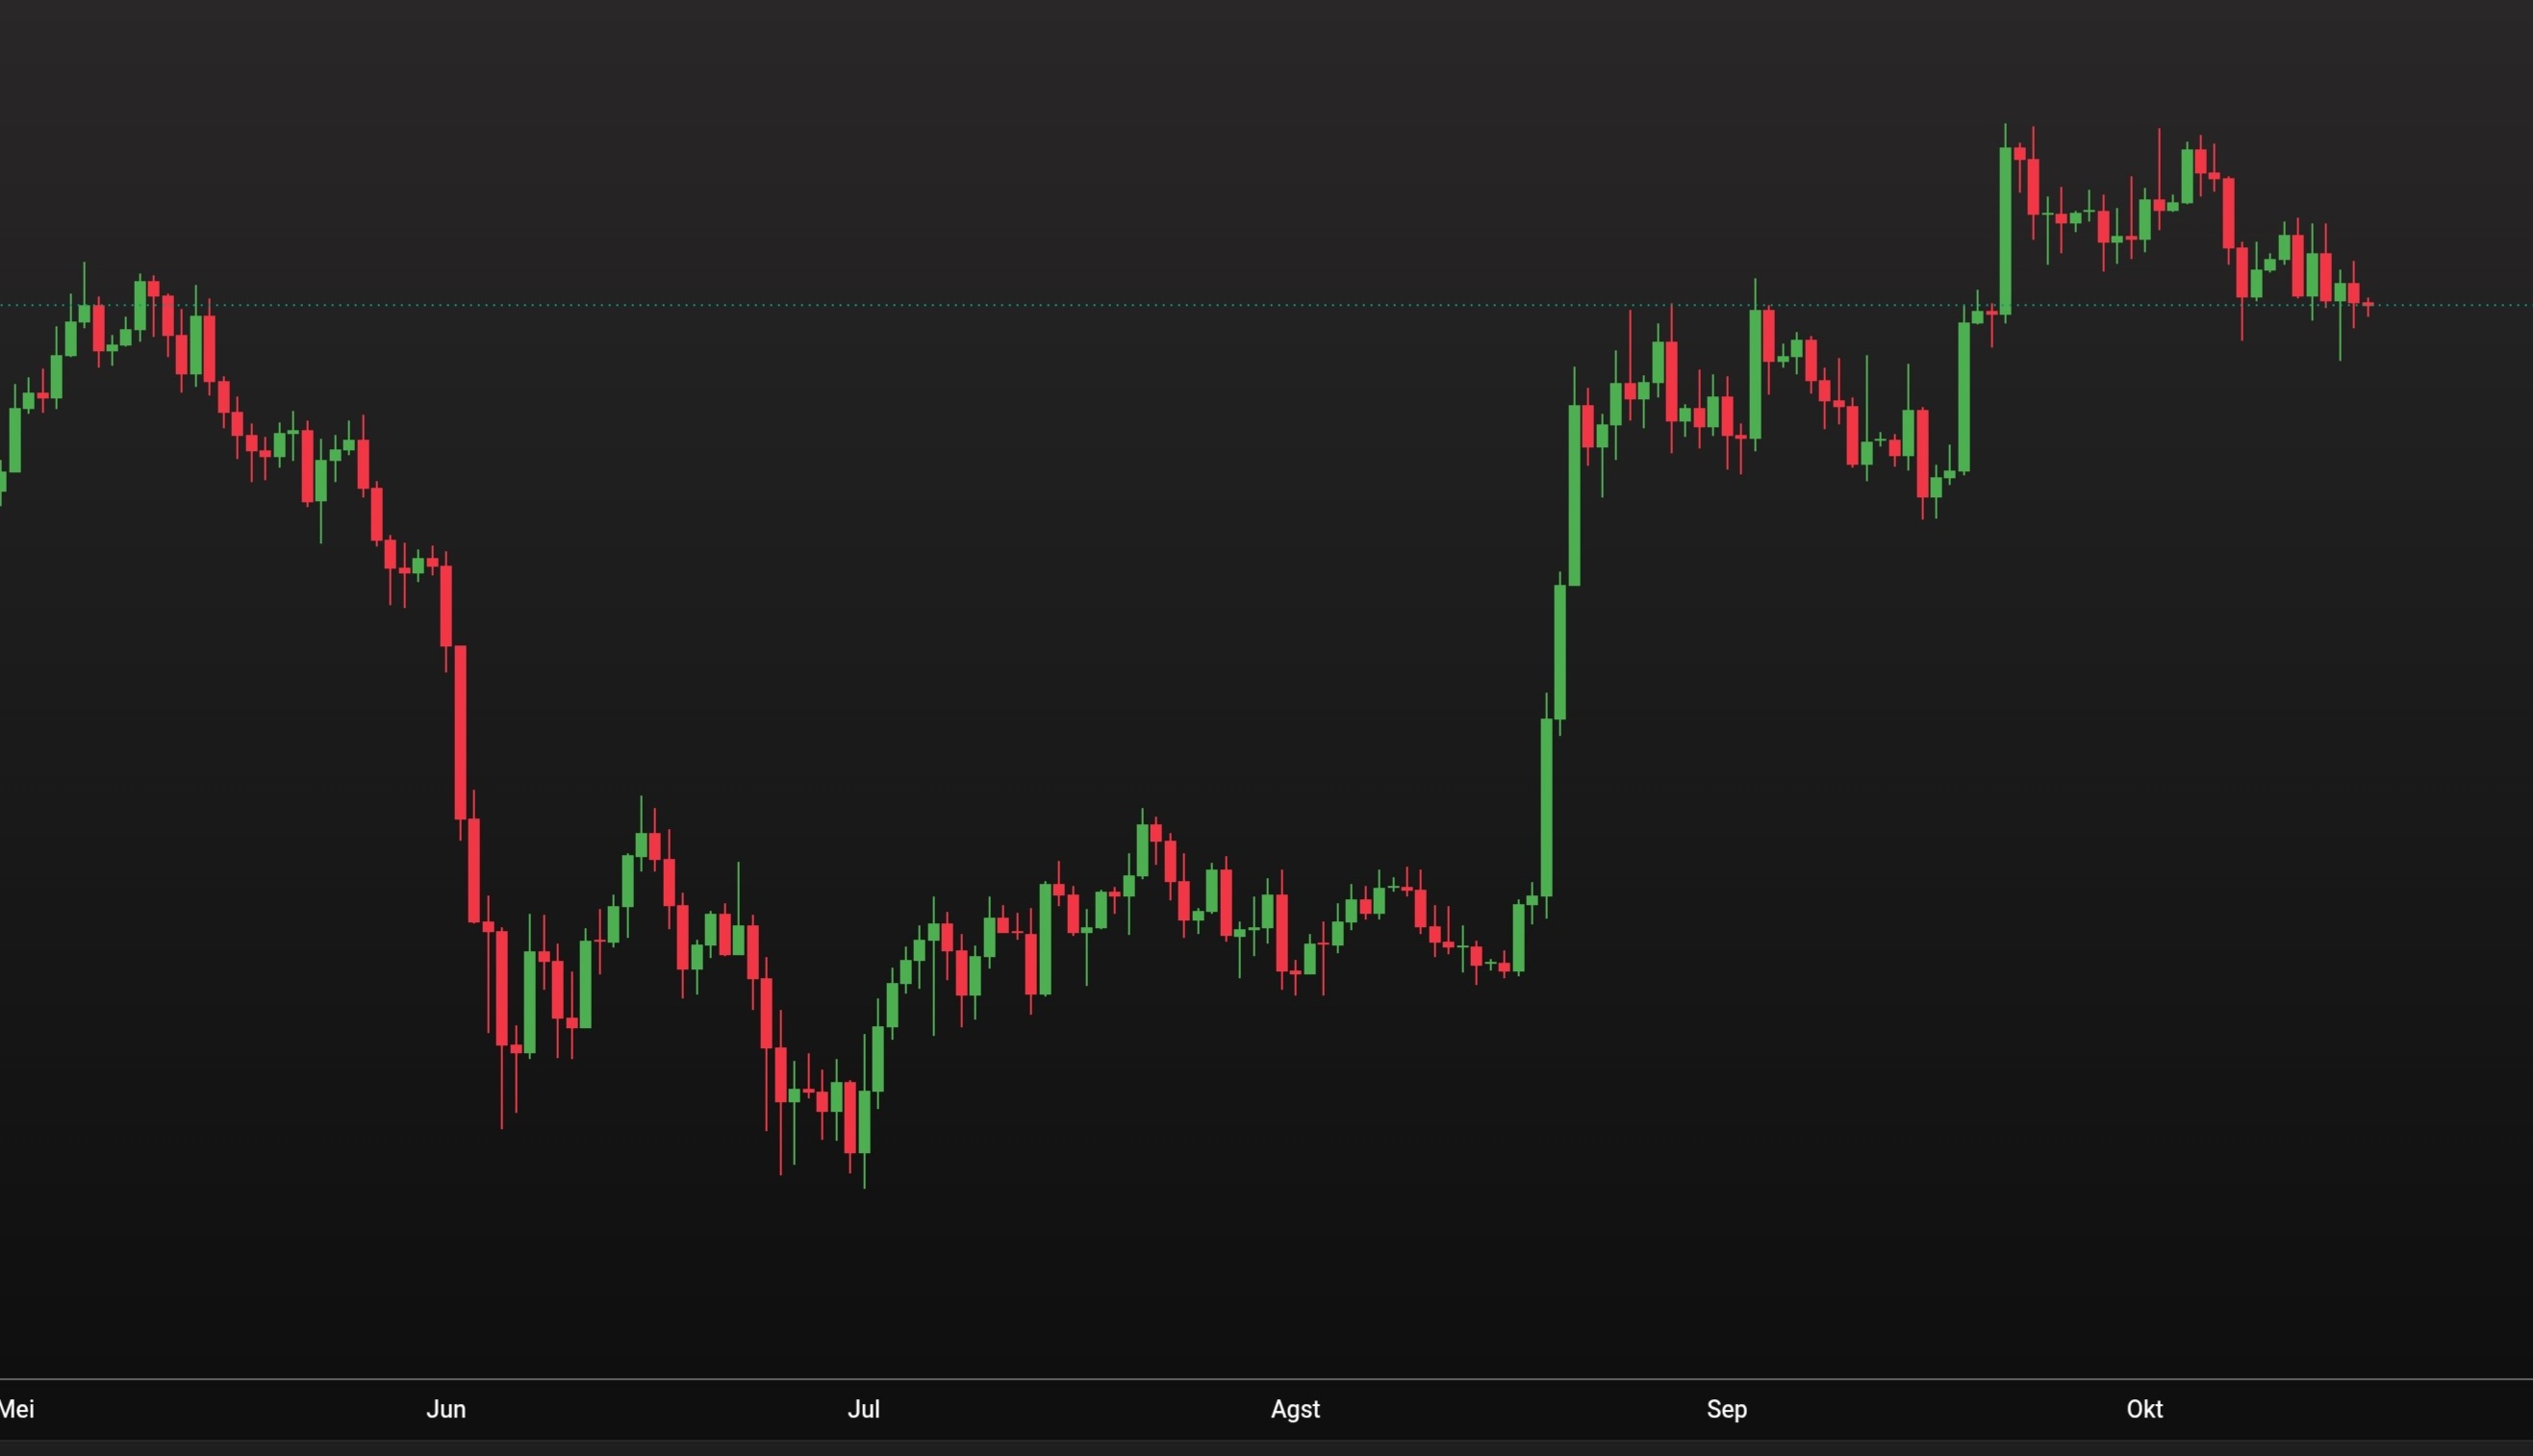
The asset has completed a successful breakout above a major multi-month horizontal resistance and is currently executing a textbook retest of this key level. Holding above this established support zone presents a favorable risk-reward entry for a bullish continuation move toward recent highs.
Trend
The chart illustrates a strong macro transition from a major downtrend in May-June to a powerful uptrend initiating in August. The initial decline pushed prices down into a bottom in early July, after which buyers initiated higher highs and higher lows through August. A violent bullish breakout occurred in late August and September, advancing the asset significantly into new high territory by October. The current price action represents a healthy corrective retracement back to the primary breakout level, while the broader macro uptrend remains firmly intact as long as this support holds.
Patterns
A classical breakout and retest structure is prominently displayed across the chart. In August and September, the price established a prominent horizontal ceiling, visible near the dotted horizontal reference line. After a decisive green impulsive candle broke above this ceiling in mid-September, the market reached a local peak in October. The subsequent pulled-back candles represent a pullback into the former resistance turned support, forming a potential bullish flag or retest base right at the structural pivot point.
Indicators
Direct overlay indicators such as Moving Averages, RSI, MACD, and Volume are not explicitly plotted on this minimalist chart layout. However, pure price action shows strong buying momentum during the August and September rally legs characterized by large green marubozu-style candles. The current consolidation near the dotted support line shows diminishing candle body sizes, indicating seller exhaustion as price approaches the key demand zone.
Strategy
The optimal strategy is to enter a long position around the current retest zone near the horizontal support level. A protective stop-loss should be set just below the recent swing structure and support line to guard against a false breakout scenario. The primary take-profit target should be aligned with the peak resistance established during the high in October, offering an attractive risk-to-reward ratio greater than 2:1.
For reference only, not investment advice. Trading decisions are your own.