Chart Buy analysis
- Confidence
- 75
- Entry
- 80,000
- Target
- 85,000
- Stop
- 78,500
- Published
- 2026-10-26
Summary
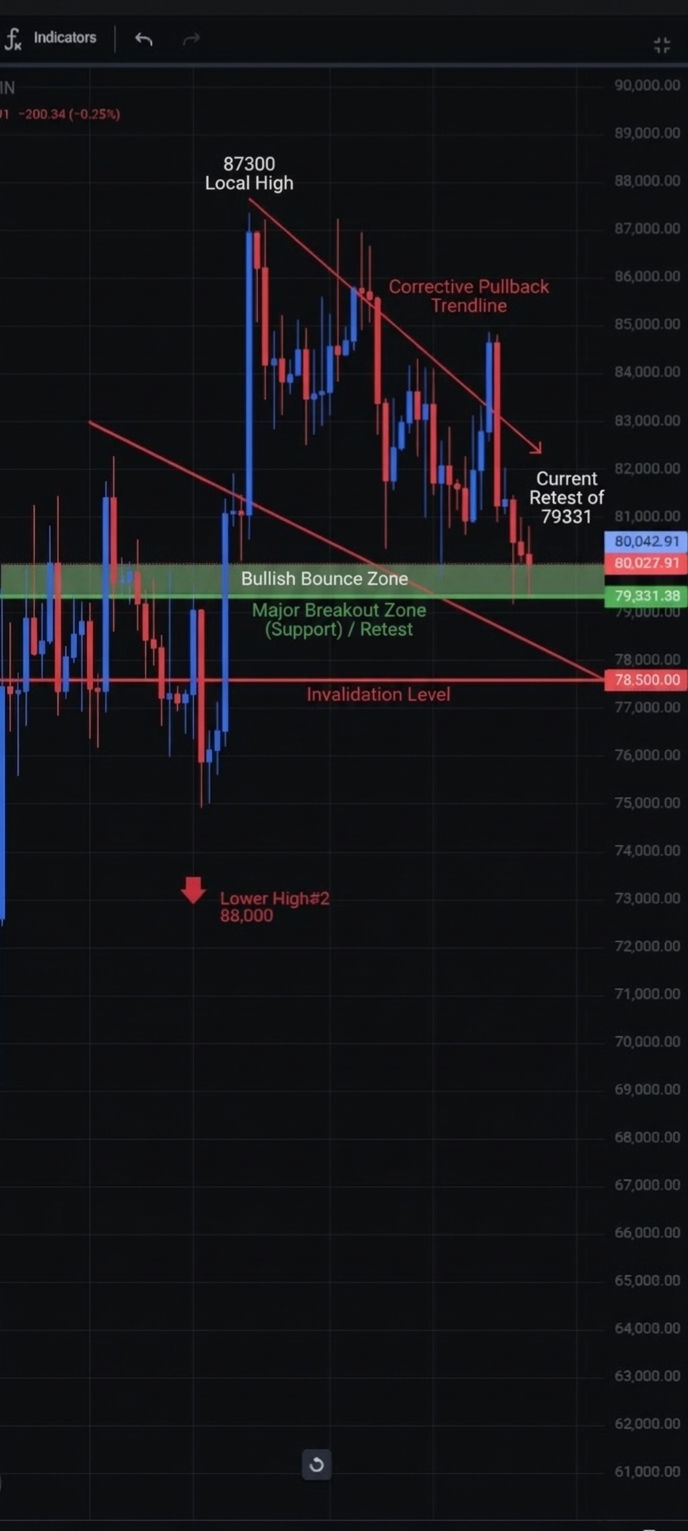
The asset is currently executing a textbook retest of its major prior breakout zone around 79331 after pulling back from local highs near 87300. Holding above this critical horizontal support provides an attractive risk-to-reward long setup expecting a bullish bounce.
Trend
The chart illustrates a strong expansion phase that surged from the 75000 area up to a peak near 87300 in mid-September. Following this top, price action has experienced a corrective pull-back marked by a series of lower highs down to the current level around 80027. Despite the short-term pullback, the broader structural trend remains constructive as long as price holds above the key horizontal breakout level at 79331. A decisive break below 78500 would invalidate this bullish retest thesis.
Patterns
A classical 'breakout and retest' pattern is prominently visible on the chart. The strong horizontal green line at 79331 previously served as significant resistance before being decisively broken by a large bullish impulse candle. The current descent brings price right back to test this former resistance level as fresh support, which typically offers a high-probability bounce entry for trend followers.
Indicators
Standard momentum indicators like RSI and MACD are not explicitly plotted in separate panels on this specific chart layout. However, price action relative to the key horizontal level at 79331.38 and the descending trendline indicates that seller momentum is diminishing as price contacts major support. Volume metrics are also unpopulated on the visible axis, requiring reliance purely on price action and key level dynamics.
Strategy
Initiate a long position around current levels near 80000, closely hovering above the green horizontal support zone at 79331. Set a protective stop loss slightly below the prior consolidation wicks at 78500 to manage downside risk effectively. The primary profit target is set at 85000, representing the logical resistance area formed by the recent lower highs.
For reference only, not investment advice. Trading decisions are your own.