Chart Sell analysis
- Confidence
- 75
- Entry
- 695
- Target
- 670
- Stop
- 712
- Published
- 2026-11-05
Summary
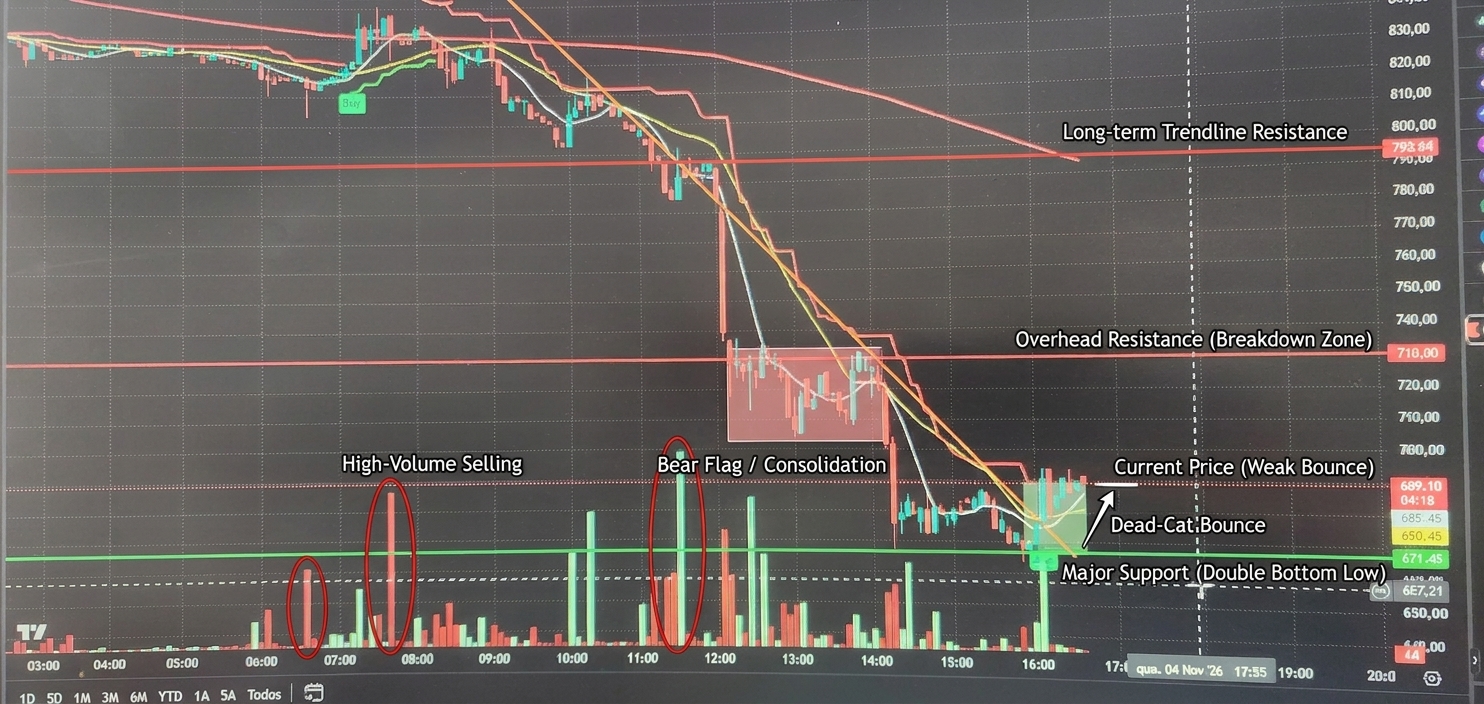
The asset is in a dominant, high-volume downtrend, having fallen sharply from above 830.00 to a low around 671.45. Despite a minor local bounce and short-term buy signal near the bottom, the broader trend remains strongly bearish under heavy overhead resistance.
Trend
The chart illustrates a clear, aggressive downtrend across the displayed intraday timeline. Price plummeted from the 820.00-830.00 area down toward 671.45, representing a decline of over 18%. All major moving averages, including the long-term trendline currently near 793.64, are sloping downward steeply. The minor recovery attempt currently sitting around 689.10 is trading well below overhead resistance levels, confirming that sellers maintain firm control of the macro direction.
Patterns
The price action reveals a severe breakdown pattern followed by a low-volume bear flag/consolidation zone near the absolute low. A massive red drop candle accelerated the move down to 710.00-720.00 around 12:00, followed by another leg down around 14:30 into 671.45 support. While a recent small double bottom formed around 671.45 triggering a local buy alert, the pattern resembles a weak dead-cat bounce rather than a true structural reversal.
Indicators
Volume spiked dramatically during the sell-offs around 10:30, 11:30, and 12:30, demonstrating strong institutional selling pressure. Moving average ribbons are widely spread downward; although short-term fast MAs (green line at 685.45, yellow line at 680.48) have flattened and crossed upward slightly, the longer red resistance boundary around 697.00-700.00 poses immediate dynamic resistance. Additional technical indicators like RSI are unavailable on this layout, but volume-price distribution strongly heavily favors bears.
Strategy
The primary plan is to sell into the current minor corrective rally towards overhead resistance around 695.00-700.00. Position size should be kept conservative given the potential for sharp volatility near the lows. Invalidation for this short setup occurs if price closes firmly above 710.00, while targets reside near recent swing lows.
For reference only, not investment advice. Trading decisions are your own.