HW_100 Buy analysis
- Confidence
- 75
- Entry
- 19,412
- Target
- 19,780
- Stop
- 19,200
- Published
- 2026-11-07
Summary
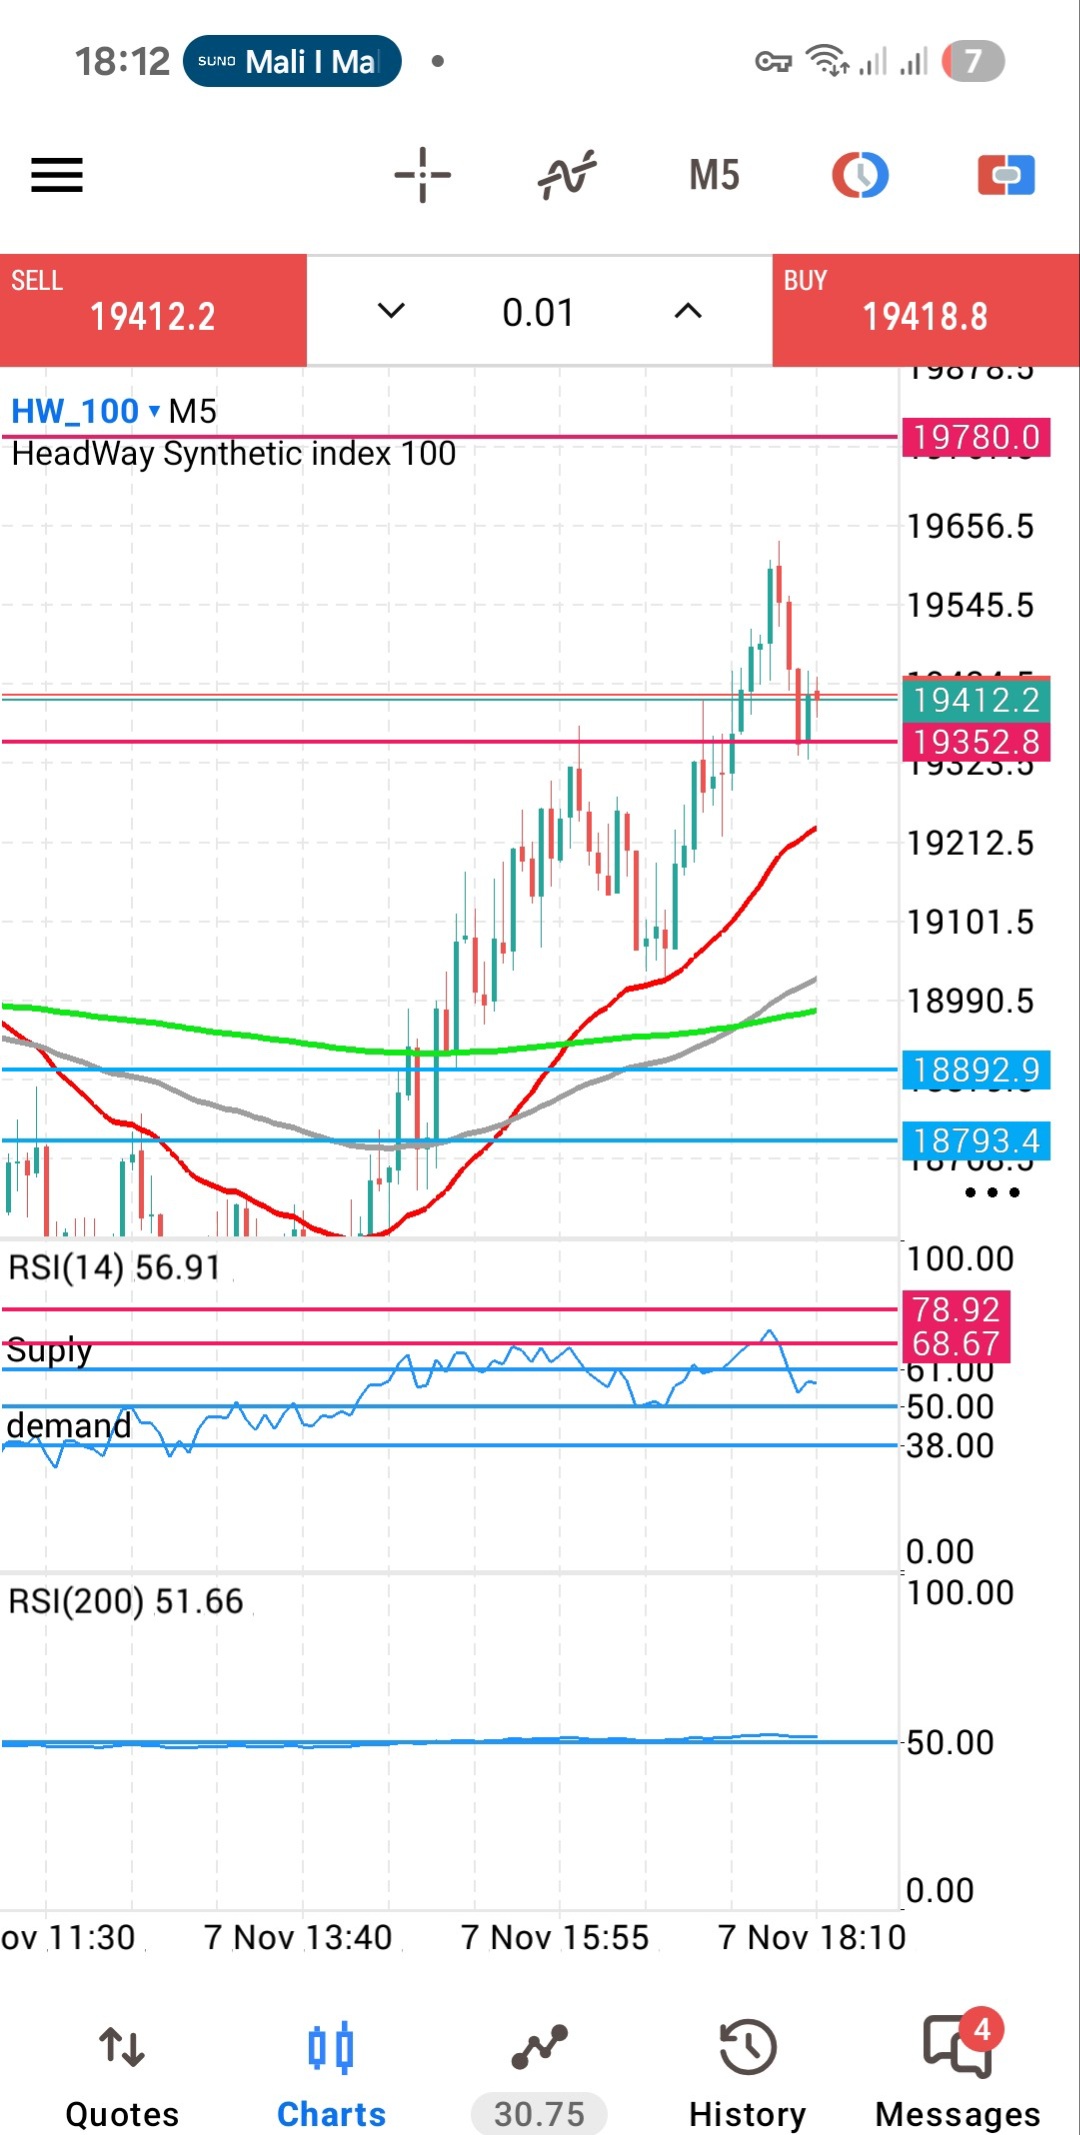
The asset is experiencing a short-term pullback following a strong bullish breakout from its previous base near 18800 up to a local high of 19600. Buying near the immediate support cluster around 19352.8 offers an attractive risk-to-reward ratio for a retest of the recent peaks.
Trend
On the 5-minute chart, HW_100 established a clear uptrend following a sharp reversal around 18700. The asset broke above key short and mid-term moving averages with high momentum, rallying over 4% to peak near 19600. Price is currently pulling back toward the 19352.8 horizontal level, which aligns as a key retest area. The fast moving average (red line) is sloping upwards strongly and remains positioned well above the slower moving averages (grey and green lines), confirming that the overall short-term structure remains firmly bullish unless price falls below 19100.
Patterns
The price action displays a strong bullish impulse wave followed by a sharp profit-taking retracement candle, forming a potential higher-low structure near 19352.8. Before this rally, the asset established a rounding bottom pattern around 18700, which triggered the strong vertical advance. The immediate upside target based on this structural expansion points toward the major resistance line plotted at 19780.0.
Indicators
The RSI(14) indicator is currently reading 56.91, cooling down from previously overbought territory near 68.67 to 78.92, which indicates healthy consolidation without breaking bullish sentiment. The longer-term RSI(200) sits steadily around 51.66, reflecting a stable baseline bullish trend context. Volume data is not explicitly displayed as a separate panel, but the aggressive candlestick ranges on the push upward confirm strong buyer backing during the advance.
Strategy
Look to initiate a long position on the current dip near the 19400 level, utilizing the strong horizontal support line at 19352.8 as a buffer. Place a tight stop loss just below the recent swing low and short-term MA confluence at 19200 to protect capital. Take profit should be targeted near the recent peak at 19600 for a first target, with a secondary target at the main resistance line near 19780.
For reference only, not investment advice. Trading decisions are your own.